Annex 7
Executive Summary, Black Sea Pollution Assessment (1999)
The present assessment of pollution in the Black Sea was completed in
accordance with the requirements of the Black Sea Strategic Action Plan,
signed by the Ministers of the Environment (or equivalent) of Bulgaria,
Georgia, Romania, Russia, Turkey and Ukraine, on 31st October, 1996. It
gathers objective and verifiable information on the sources, levels and effects
of pollution in the Black Sea as well as the preventative and remedial
measures that are being taken in the region. Its main conclusions are the
following:
The Black Sea ecosystem has been seriously damaged as a result of pollution.
There is clear evidence to relate the decline of shelf seas ecosystems to
eutrophication caused by increased loads of nitrogen and phosphorus. Much
of these loads arise from major rivers, notably the Danube, but also from
smaller sources in all Black Sea coastal countries. According to current
estimates, some 70% of the dissolved nitrogen and phosphorus entering the
Black Sea comes from the six Black Sea countries, either through discharge to
the major rivers (notably the Danube) or from direct sources. The remaining
30% originate from the 11 non-coastal countries that belong to the Black Sea
basin. There is insufficient information to apportion individual responsibility
for contribution to these loads amongst these eleven countries. Furthermore,
in addition to the dissolved nutrients entering the sea, estimates for nitrogen
compounds suggest that an amount equivalent to some 50% of the dissolved
load may be entering the system from atmospheric sources of indeterminate
origin. The dissolved load is particularly significant however, as it directly
impacts the shelf- zone systems which are critical to the he alth of the overall
Black Sea ecosystem.
All six Black Sea countries contribute to the loads of contaminants entering
the Black Sea. In the case of nutrients, the contribution is directly related to
agricultural drainage, with lesser contributions from domestic sources and
industry. The situation was particularly bad in the decades of the 1970s and
1980s but recent economic decline in the industrial and agricultural sectors
have lowered the nitrogen and phosphorus inputs through the Danube to
levels observed in the 1960s. This has resulted in very gradual improvements
in the health of the NW Shelf and provides some hope that recovery might be
possible. However, unless urgent measures are taken to keep nutrients on
land, the recovery may be reversed as economic conditions improve and the
use of chemical fertilisers resumes.
Extensive oceanographic studies of the Black Sea have not revealed any
evidence of a decrease in depth of the interface between oxygenated surface
waters and hydrogen sulphide rich bottom waters. The risk of a massive
release of hydrogen sulphide gas from the deep Black Sea to the atmosphere
remains minuscule. It will be important to continue to monitor this situation
in the future.
1
Black Sea coastal waters remain heavily impacted by sewage, a situation
exacerbated by the weak economies of coastal states. In most countries there
is a serious lack of transparency regarding data on sewage indicators. Where
data exists, it results from studies using methodologies that are not inter-
comparable. Independent investigations and epidemiological data suggest that
this situation is serious and warrants urgent action. In some circumstances,
public and ecosystem health may be severely compromised. It is noted that
some countries (e.g. Romania) are already investing in new wastewater
treatment facilities but that treatment is absent or deficient in most places
around the Black Sea. There are also serious problems with solid waste
disposal. Accidental or intentional sea disposal of municipal garbage
continues in Turkey and Georgia.
Oil pollution in the Black Sea does not appear to be generalised but impacts
coastal areas around river mouths, sewerage outfalls and industrial
installations and ports. Oil discharge through the Danube can be traced well
into the north-western shelf, and at some 53,000 tons/annum, represents about
half of the estimated total annual load of oil to the Black Sea. There is little
or no data on operational discharges from ships and, unless properly
regulated, the increase in shipping through the Black Sea could result in
significant oil pollution. Reported sediment concentrations of oil residues as
high as 1% (Sevastopol) illustrate the danger of unregulated harbour
operations.
There is no evidence for significant heavy metal pollution in the Black Sea.
Further studies are still required around industrial centres and ports but
generalised pollution by these substances can be discounted.
The Black Sea has a significantly higher concentration of human produced
radionuclides than the neighbouring Mediterranean. This problem is mainly
attributable to the Chernobyl accident in 1986. Present levels or radioactivity
do not appear to pose a significant health hazard to humans but it will be
important to monitor the situation in the future. Capacitating local institutions
for this purpose is continuing.
There is no evidence of system-wide pollution of the Black Sea with
pesticides and other persistent organic pollutants (such as polychlorinated
biphenyls, PCBs, or polyaromatic hydrocarbons, PAHs). Levels or these
substances in some nearshore areas are elevated however. Current coastal-
zone data is restricted to a few sites that were monitored through the efforts
of the Black Sea Environmental Programme. Most historical data has been
shown as unreliable. It will be important to complete a study of all coastal
countries in order to detect any significantly contaminated areas.
Pioneering studies on the non-lethal effects of pollution to mussels (as
indicator organisms), conducted in a pilot scale in all Black Sea countries,
have indicated significant cell damage in many instances. There appears to be
a relationship between the level of damage and the proximity to major
effluent discharges. Levels of cell damage at some coastal sites on the north-
western shelf of the Black Sea were amongst the highest recorded in any
2
study using similar techniques. It is not possible at this juncture to ascribe the
damage to a particular type of pollutant but it provides clear evidence of the
need for measures to control land- based sources of pollution in order to
restore ecosystem health.
The present assessment highlights the insufficiency of current programmes
for pollution monitoring in the region. With the exception of Romania, Black
Sea countries are not monit oring pollution in a systematic manner. The
current lack of comparable information will make it impossible to measure
future trends in contamination, assess compliance with the Bucharest
Convention or Black Sea Strategic Action Plan, or to adequately protect
ecosystems and public health. In most cases, governments are not making the
necessary resources available for this work despite the provision of equipment
and training through GEF and European Union (Tacis) funding.
The Black Sea countries have adopted a framework of policies and law which,
when fully implemented, should enable pollution to be controlled and abated.
A similar situation exists in the non-coastal countries, inter-alia through the
work of the International Commission for the Protection of the Danube River.
A suite of harmonised water quality objectives have been proposed for the
Black Sea in compliance with the 1996 Black Sea Strategic Action Plan.
Implementation of the Plan however, is behind schedule. Urgent efforts are
needed by the Black Sea countries and the international community to enable
full implementation of this important comprehensive Plan.
3
Annex 8 : Summary of decisions and recommendations made by the 5th meeting of the
Black Sea Commission
The 5th Meeting of the Black Sea Commission was held under the
chairmanship of Ambassador F�gen Ok, Turkey on 27/28th of April 2000 in
Istanbul.
The Meeting agreed on the following decisions and recommendations.
1.
* The Commission authorized the Chairperson Ambassador
F�gen Ok to sign on behalf of the Commission, the
Headquarters Agreement of the Black Sea Commission with the
representative of the Government of Turkey. Accordingly, the
Headquarters Agreement was signed on 28th April 2000, in
Istanbul.
* The Agreement on Privileges and Immunities was signed on
28th April 2000 by those members of the Commission who had
their governments' authorisation to do so: Bulgaria, Georgia,
Romania and Turkey. Ukraine and Russia who did not have their
governments' authorisations will sign the Agreement in due
time through diplomatic channels.
* The Turkish government, as the host country, has declared that
it could unilaterally offer these Immunities and Privileges
through a Council of Ministers' decree, as was practiced in
other international organizations whose Secretariats were
situated in Istanbul, if the Agreement on Privileges and
Immunities will not be signed by all parties before the
Secretariat started operating.
2. Setting up the Secretariat:
* The PIU will circulate the job descriptions of the Executive
Director and the five other professional posts to the Commission
members by 1st June 2000.
* The Commission authorized the Turkish Government to open a
special account for the budget in the name of the Black Sea
Commission whic h will be turned over to the Executive Director of the
Secretariat when he/she is in function.
* Financial contributions by the Contracting Parties are
expected to be made to this account, the latest by 1st September
2000. Those Contracting Parties who have made full or partial
contributions to the budget may nominate up to two candidates,
through the PIU, for the two vacancies by 1st September 2000 .
* The PIU will circulate the CVs of the nominees to members of
the Commission.
* The next meeting of the Commission will be on 14th �15th
September 2000 under the Chairmanship of Ukraine, to consider
these nominations, decide on recruitment and discuss the budget
for the next financial year.
4
* The Secretariat shall come into operation on 15th October
2000.
3. The Commission reconsidered and readapted the budgets for the
financial year 1 September 2000- 31 August 2001, as attached.
4. The Commission also reconsidered the workplan and adopted it, as
attached.
5. The Commission reaffirmed its commitment to implement the
Strategic Action Plan for the Rehabilitation and Protection of the
Black Sea (BS -SAP) signed on behalf of all six countries on 31
October 1996. In this respect and in accordance with paragraph 20
of the BS-SAP, it agreed to incorporate the existing project
implementation unit and the Black Sea Environmental Programme
as part of its organic structure. The BSEP-PIU will act as "the body
to provide support for specific projects related to the
implementation of the Strategic Action Plan". It will operate on the
basis of terms of reference to be agreed between the Commission
and the donor community.
6. The Meeting reviewed the draft Memorandum of Understanding
prepared by the Danube Commission (ICPDR) to be adopted by the
Commission and the ICPDR.
The Russian, Turkish and Ukrainian delegations asked for
amendments. The revised version of the Memorandum of
Understanding, as agreed by the Commission, will be sent to the
Danube Commission with a view to agree on a common text for the
final signature.
7. The Commission proposed that the "Ad-hoc Technical Working Group"
set up on December 9, 1997 in Constanta between the ICPBS and the
ICPDR follows-up the implementation of the Convention's strategic goals,
outlined in the forthcoming Memorandum of Understanding between the
ICPBS and the ICPDR and a coordinated approach to implement
provisions of the two UNDP/GEF regional projects for the Black Sea and
the Danube River Basin.
8. The Commission examined the information note by the UNEP Regional
Office for Europe, on the Nutrient Oriented GPA Protocol to the Bucharest
Convention/GEF PDF-B "Black Sea".
The representative of EC-DG Environment proposed the addition of the
following "the study shall also take into account relevant existing EU
legislation, in particular the forthcoming EU Water Framework Directive".
The Commission took note of the information note and asked UNEP to
carry on the study.
9. The Commission took note of the UNDP/Turkey's role as Principal Project
Resident Representative Office and, in this context, requested its support
for
5
the preparation and handling of the next meeting of the Commission in
September 2000.
10. The 6th meeting of the Black Sea Commission will be held on 14th �
15th September 2000 under the Chairmanship of Ukraine, who will
take over the Chairmanship from Turkey as of May 1, 2000.
Enclosures:
Draft Memorandum of Understanding between the International Commission for the
Protection of the Black Sea (ICPBS) and the International Commission for the
Protection of the Danube River (ICPDR) on common strategic goals
� The `International Commission for the Protection of the Black Sea (ICPBS)'
was established to implement the `Convention on the Protection of the Black
Sea against Pollution'. This Convention is a `shoreline convention', i.e. it
itself holds no power over the inland activities of the States within the
hydrographic drainage area discharging to the overall Black Sea (Black Sea
proper, Sea of Azov).
� The `International Commission for the Protection of the Danube River
(ICPDR)' was established to implement the `Convention on Cooperation for
the Protection and Sustainable Use of the Danube River'. This Convention is a
`hydrographic basin convention' , i.e. it itself holds power over the
transboundary impact via the drainage network of the River Danube Basin
(valid only for Contracting Parties to this Convention).
� This Memorandum of Understanding becomes effective as soon as it has been
agreed upon in the respective Meetings of both Commissions mentioned and
an exchange of letters has taken place. It looses its effectiveness as soon as
one of both the International Commissions mentioned notifies the other.
� This Memorandum of Understanding constitutes a framework for
implementing common strategic goals.
Representatives of the ICPBS and the ICPDR with the assistance of UNDP/GEF and
UNEP set up on December 8 and 9, 1997, a Joint Ad-hoc Technical Working Group
(`the Group') in a Meeting at Constanta, Romania. The following elements of this
Memorandum of Understanding correspond w ith the results of `the Group':
� For the purpose of this Memorandum, the term `overall Black Sea'
encompasses the Black Sea proper and the Sea of Azov as water bodies
receiving inputs via inland waters. Both the Black Sea proper and the Sea of
Azov are in regard to their ecology and their response to discharged pollution
6
completely different water bodies and their ecosystems are to be considered
separately.
� The term `Black Sea Basin' refers to the basin determined by the hydrographic
boundary of all inland waters discharging to the overall Black Sea and the
surface area of the overall Black Sea.
� The results of the studies on the `Ecological Indicators of Pollution in the
Black Sea' carried out in the frame of the activities of the Joint Ad-hoc
Working Group, have given evidence of recovery in Black Sea ecosystems.
However, the ecological status of the 1960s � which is deemed to be the goal
to aim for � is not yet reached.
� There is in general agreement that the status of Black Sea ecosystems is
largely affected by nutrients discharged within the wider Black Sea Basin, and
to a large extent by the riverine input into the overall Black Sea. Information
of a possible role of other sources of pollution and their impacts on Black Sea
ecosystems was not yet available.
� The size of the pollution loads reaching the overall Black Sea (dispersion both
in time and in space for the Black Sea proper and the Sea of Azov) are either
not known, or information is missing on the comparability of the data
available.
� `The Group' was aware of the decline of the economic activities in the
countries in transition, the possible impact of them on the discharge of
pollution, and the reversal of such a trend in case of future economic
development (concerning in particular agricultural and industrial activities).
� The data available to `the Group' to undertake its assessment ended at best
with values for the year 1997.
In order to safeguard the Black Sea from a further deterioration of the status of its
ecosystems the `Commission for the Protection of the Black Sea against Pollution'
and the `Commission for the Protection and Sustainable Use of the Danube River' to
achieve the following common strategic goals:
� The long-term goal in the wider Black Sea Basin is to take measures to reduce
the loads of nutrients and hazardous substances discharged to such levels
necessary to permit Black Sea ecosystems to recover to conditions similar to
those observed in the 1960s.
� As an intermediate goal, urgent measures should be taken in the wider Black
Sea Basin in order to avoid that the loads of nutrients and hazardous
substances discharged into the Seas exceed those that existed in the mid
1990s. (These discharges are only incompletely known.)
� The inputs of nutrients and hazardous substances into bo th receiving Seas
(Black Sea proper and Sea of Azov) have to be assessed in a comparable way.
To this very end a common Analytical Quality Assurance (AQA) system and a
thorough discussion about the necessary monitoring approach, including the
7
sampling procedures, has to be set up and agreed upon between the ICPBS
and the ICPDR..
� The ecological status of the Black Sea and the Sea of Azov has to be further
assessed, and the comparability of the data basis has to be further increased.
� Both the reported input loads as well as the assessed ecological status will
have to be reported annually to both the ICPBS and the ICPDR.
� Strategies for economic development have to be adopted to ensure appropriate
practices and measures to limit the discharge of nutrients and hazardous
substances, and to rehabilitate ecosystems which assimilate nutrients.
� Based on the annual reports and on the adopted strategies for the limitation of
the discharge of nutrients and hazardous substances, a review shall be
undertaken in 2007. It will have to focus on the further measures that may be
required for meeting the long-term objective.
The ICPDR and the ICPBS invite all other international organisations and
States in the wider Black Sea Basin to support the common goals of this
Memorandum of Understanding.
8
Revised budget1 of activities to be undertaken under the Convention on the protection
of the Black Sea against Pollution for the first year of Activity
A. Revenues (Assessed contribution)
Country Share of Percentage(%)
USD
Bulgaria 12 43
560
Georgia 12
43 560
Romania 12
43 560
Russian Federation 12
43 560
Republic of Turkey 40
145 200
Ukraine 12
43 560
TOTAL 100
363 000
B. Costs
1. Operational costs
1.1 Maintenance
3 000
1.1.1 Office furniture, upholstery, carpeting
1.1.2 All other office equipment
1.2
Communication charges
27 000
1.2.1 Telephone, fax, postage
9
1.3
Publication
10 000
1.3.1 Secretarial documents, meeting reports
1.3.2 Information and promotional material
1.3.3 Annual report (yearbook), maps, card, etc
1.4 Purchase or subscriptions of books, newspapers, magazines
2 000
1.5
All kind of stationary
4 000
1.6
Temporary assistance
5 000
1.6.1 Interpretation or translation
1.6.2 Secretarial work
1.6.3 Consultancy
1.6.4 Expertise
1.6.5 Vehicle renting
1.7
Unforseen costs
7 000
Sub-Group Percentage: 15.97% Sub-Group Total
58 000
2. Personnel costs
2.1
Salaries, wages, medic al/social insurance
150 000
2.1.1 Director (1) - 4 500
2.1.2 Officer (1) - 3 500
2.1.3 Accountant (1) - 700 (half -time)
2.1.4 Secretary (1) - 1 300
Sub-Grou p Percentage: 41.33% Sub- Group Total
150 000
2.2
Meetings
155 000
2.2.1 Transportation
2.2.2 Per-diems
2.2.3 Representation
Sub-Group Percentage: 42.70% Sub- Group Total
155 000
10
GRAND TOTAL 363
000
1UNDP will allow the Secretariat to use the furniture and office
equipment already in place in the PIU
11
Workplan of the Secretariat of the Istanbul Commission for the first year of its activity
I. Establishing the Commission and Secretariat network
Area of Work
Activity
Partners
Estimated cost
1
Establishment of the office and
Commission-
accounting system as well as the general Secretariat
administrative practices of the
secretariat
2
Establishment of the necessary Advisory Commission-
In-kind contribution from the
Groups
Secretariat
countries
3
Exchange of letters of agreement and
Secretariat
No funds required
cooperation with similar bodies such the
Barcelona Commission, OSPARCOM,
HELCOM, etc, Black Sea Economic
Cooperation, European Commission,
specialised UN Agencies (UNEP, IOC,
IMO etc) and international non-
governmental organisations
II. Policy Actions
Area of Work
Activity
Partners
Estimated cost
4
Establishment of harmonised Water
Meeting of Advisory Group on
Tacis and Phare
$ 15 000
Quality Objectives and Water Quality
Pollution Monitoring and
Standards in order to reduce the inputs
Assessment � Consultants
12
of pollutants
5
Establishment of a Regional Pollution
Meeting of Advisory Group on
Tacis and Phare
$ 20 000
Monitoring System in compliance with
Pollution Monitoring and
the Bucharest Convention. The
Assessment-Consultants-National
programme will integrate the national
Monitoring Authorities
pollution monitoring programme. An
independent quality assurance system
will be developed.
6
Define concentration levels for trace
Meeting of Advisory Group on
$ 15 000
contaminants in dredged spoils, in
Pollution Monitoring and
accordance with article 3 of the Protocol Assessment-Consultants
on Dumping to the Bucharest
Convention
7
To agree upon and implement a uniform Meeting of Advisory Group on
WHO, EC (Tacis -
$ 15 000
measurement technique and reporting
Control of Pollution from Land
Phare)
procedure for bathing water quality with Based Sources-WHO
a common quality assurance support
mechanism
8
Procedures for monitoring the actual
Advisory Group on Control of
$ 25 000
discharge of effluent at point sources
Pollution from Land Based Sources-
2 meetings
9
To develop a draft text of a protocol on
Advisory Group on the
$ 15 000
Biological Diversity and Landscape
Conservation of Biological
Protection to the Bucharest Convention
Diversity-Consultants
10
To develop a harmonised system of port Advisory Group on Environmental
Danish EPA, IMO
No funds required
state control through the adoption of a
and Safety Aspects of Shipping-
Memorandum of Understanding on Port Consultants
State control
11
To finalise the National and Regional
Advisory Group on Environmental
IMO
$ 15 000
13
Contingency Plans
and Safety Aspects of Shipping-
Consultants
2 meetings
12
Establishment of a harmonised system
Meeting of Advisory Group on
Phare, FAO
$ 8 000
of fish stock assessment
Fisheries and other Marine Living
Resources-Phare consultants
13
The elaboration and adoption of a Black Each Black Sea country will
$ 12 000
Sea Coastal Code of Conduct based
establish the legislative bases for
upon the Black Sea National and
the adoption of said document in
Regional Policies and Strategies and, as accordance with the Strategic
a guideline document, The Council of
Action Plan
Europe's European Code of Conduct
for Costal Waters".
14
The co-ordination of increasing the
-The Black Sea Newsletter will be
Black Sea NGO
$ 15 000
public awareness on the Bucharest
published jointly with the PIU;
Forum,
Convention and Action Plan
-Each Black Sea state will publish a International
popularised version of its Strategic
NGOs
Action Plan;
-Developing and updatin g the
Commission Home Page on Internet;
-An information package for use in
schools will be produced and
translated into all Black Sea
languages
-Implementation of regionally
coordinated public awareness
campaigns, including programs for
schools, local communities and
natural resources users.
14
TOTAL
$ 155 000
15
16
17
Annex 9-
DRAFT REGIONAL NUTRIENT
ACTION PLAN FOR BLACK SEA
RIPARIAN COUNTRIES
SEPTEMBER 2000
Prepared by: W Parr1, A Varduca2, M Stoimenova3,
O Tarasova 4, A Shekhovstov5, L
Stepanova6, M Kerestecioglu7 and Z
Lomtadze 8
1Regional Ecologist, Thames Region Environment Agency, Kings Meadow
House, Kings Meadow Road, Reading, RG1 8DQ, UK. Tel: +44 (0)118
9535405. E-mail: bill.parr@environment-agency.gov.uk
2ICIM, Ministry of Water, Forests and Environmental Protection,
Environmental Research and Engineering Institute, 77703, sector 6, Spl.
Independentei 294, Bucharest 78, Romania. Tel: 401 221 92 25. E-mail
lipopesc@pcnet.pcnet.ro
3Environmental Consultant, 41 Luben Karavelov St, 1142 Sofia, Bulgaria.
Tel: +359 2 237 498. E -mail: marietta@mail.techno- link.com
18
4.UN peace Corps/Ukraine expert for the Ministry of Ecology of Ukraine. Tel:
220 1183 (380 44). E -mail: tamur@carrier.kiev.ua
5Director General, State Centre of Ecological Programmes, State Committee
of the Russian Federation for Environmental Protection, 123812 Moscow,
Russia, st B Gruzinskaya, 4/6. Tel: +7 (095) 332 51 14. E -mail:
GCEP.Mos@g32.relcom.ru
6 State Committee of the Russian Federation for Environmental Protection,
Russia. Tel:+7 (095) 254 75 66. E-mail: kalyanova@mtunet.ru
7General Manager, International United Consultants Inc, UBM Plaza, 19
Mayis Cad, No. 39, 80220 Sisli, Istanbul, Turkey. Tel: 01212 275 66 40. E-
mail: ubm@ubm.com.tr
8Ministry of Environment and Natural Resources Protection. Tel: + 995 32
230664. E -mail: gmep@caucasus.net
19
20
TABLE OF CONTENTS
1.
INTRODUCTION ...............................................................................................................1
1.1 The framework mechanism..................................................................................................1
1.2 A strategy to achieve common pollution reduction goals....................................................2
1.3 GEF nutrient reduction programme .....................................................................................3
1.4 Eutrophication......................................................................................................................4
1.5 Nutrient cycling....................................................................................................................5
1.6 The way forward..................................................................................................................7
2.
BULGARIAN NATIONAL NUTRIENT ACTION PLAN ................................................9
2.1 Immediate objectives, priority sub-objectives, measures and activities for
nutrient reduction .................................................................................................................9
2.2 Institutional strengthening and capacity building ..............................................................11
2.3 Public participation in nutrient reduction ..........................................................................11
2.4 Projects ready for implementation in the coming 5 years..................................................12
2.5 Investment framework .......................................................................................................13
3.
GEORGIAN NUTRIENT ACTION PLAN ......................................................................15
3.1 Nutrient-related legislation and policy...............................................................................15
3.2 Sectorial policy ..................................................................................................................16
3.3 Institutional and human capacity .......................................................................................17
3.4 Public support and stakeholder involvement.....................................................................17
4.
ROMANIAN NUTRIENT ACTION PLAN .....................................................................26
4.1 General approach ...............................................................................................................26
4.2 Project identification ..........................................................................................................33
4.3 Cost estimation...................................................................................................................35
5.
RUSSIAN NUTRIENT ACTION PLAN..........................................................................38
5.1 Measures related to municipalities.....................................................................................38
5.2 Measures related to agriculture ..........................................................................................38
5.3 Measures related to waste disposal and utilisation ............................................................39
5.4 Measures related to normative, legal, institutional and scientific�technical
support................................................................................................................................39
6.
TURKISH NUTRIENT ACTION PLAN..........................................................................44
6.1 Actions related to legislation..............................................................................................44
6.2 Actions related to monitoring and enforcement.................................................................44
6.3 Actions related to pollution control ...................................................................................44
6.4 Other actions ......................................................................................................................45
7.
UKRAINE..........................................................................................................................49
7.1 Legal and regulatory measures ..........................................................................................49
7.2 Environmental monitoring of the Black and Azov seas ....................................................49
7.3 Low cost measures for nutrient reduction in the Black Sea Basin ....................................50
7.4 Major Ukrainian projects for nutrient reduction................................................................52
8.
DISCUSSION ....................................................................................................................62
REFERENCES ..............................................................................................................................64
21
22
1.
INTRODUCTION
1.1 The framework mechanism
Guidelines for the protection of the Black Sea against pollution are detailed in the Bucharest
Convention, which was signed on April 21st 1992 by representatives of Bulgaria, Georgia,
Romania, the Russian Federation, Turkey and Ukraine. The Convention was ratified in 1998 but
not fully implemented owing to the failure of coastal countries to reach agreement on financial
arrangements for its Secretariat. Presently, implementation of the Convention is carried out by
the Istanbul Commission for the Protection of the Black Sea (ICPBS).
The Bucharest Convention stipulates (Article VI) that each Contracting Party shall prevent
pollution to the marine environment of the Black Sea from any source of hazardous or noxious
substances and matter, as specified in the Annex to the Convention. Protection of the marine
environment against nutrients is listed in Annex II of the Convention under the statement:
`Substances which, although of a non-toxic nature, may be harmful to the marine
biota owing to the quantities in which they are discharged e.g. inorganic phosphorus,
nitrogen, organic matter and other nutrient compounds. Also substances which have
an adverse effect on the oxygen content of the marine environment'.
The Bucharest Convention also includes a Protocol for the protection of the Black Sea marine
environment against pollution from land-based sources. This annex is accompanied by two
further annexes, which separately detail the regulation of hazardous and noxious substances and
matter, including nitrogen and phosphorus. This annex does not apply to discharges that contain
nitrogen and phosphorous which are below the standards defined jointly by the Contracting
parties, not exceeding environmental background concentrations.
In April 1993, the contracting parties reaffirmed their commitment to the Bucharest Convention
by signing the Odessa Declaration. This was a pragmatic 3-year policy agreement largely
implemented with financial and technical support from the GEF and the EU. The policies within
the Declaration were carried out under the direction of the Black Sea Environmental Programme
(BSEP) Co-ordination Unit in Istanbul.
A Transboundary Diagnostic Analysis (TDA), undertaken between 1992 and 1996 demonstrated
the relative importance of different nutrient sources within the Black Sea catchment. Given that
the Danube was shown to be the largest single source of nutrient input to the Black Sea, it was
deemed imperative that strategies for the reduction of nutrients be adopted for this river.
The Strategic Action Plan (SAP) for the Rehabilitation and Protection of the Black Sea was
signed in October 1996, with adoption at Ministerial level in 1998. This document provided the
riparian countries with a wide ranging plan, which includes the setting of goals and milestones,
covering many aspects of environmental protection in the Black Sea, including nutrients. A
Project Implementation Unit (PIU) currently manages the SAP from Istanbul, Turkey, pending
the formation of the Istanbul Commission Secretariat. The SAP is designed to pay particular
attention to nutrients and defines the objective of a Black Sea Basin Strategy to negotiate a
progressive series of stepwise reductions in nutrient loads, until agreed water quality objectives
are met. To effectively tackle the problem of eutrophication, the SAP also highlights the need for
the formation of a co-operative mechanism within the entire Black Sea drainage basin.
1
With regard to the Danube, the Strategic Action Plan for the Danube River Basin, which was
adopted at Ministerial level in 1994, was initially managed by the Environmental Programme for
the Danube River Basin (EPDRB) in Vienna. Following ratification of the Danube River Basin
Convention (DRBC � known as the Sophia Convention) in 1988, the EPDRB handed over
responsibility for the SAP to the International Commission for the Protection of the Danube
River (ICPDR), a decision making body charged with implementing the DRBC.
1.2 A strategy to achieve common pollution reduction goals
In early 1998, a Joint ad-hoc Technical Working Group was established between the Bucharest
and Sofia Conventions, consisting of representatives from all of the Danube and Black Sea
States. The Terms of Reference for the Working Group detailed the primary activities, which
included the assessment of available water quality data and nutrient loadings from the Black Sea
Basin, as well as the determination of strategies and approaches for implementation of pollutant
reductions. The latter task consisted of:
(i)
Defining common pollutant reduction goals.
(ii)
Assessing whether or not the implementation plans of the SAP undertaken in the Black
Sea Basin are sufficient to achieve the common pollutant reduction goals.
(iii)
Recommending improvements and amendments to the implementation plans of the SAP
to aid in achieving the common pollution reduction goals. With regard to strategies, the
Working Group was supported by developments of National Action Plans (NAPs) for
each of the Black Sea countries and National Reviews for the Danube countries.
Co-operation between the Istanbul Commission for the Bucharest Convention (Black Sea) and
the ICPDR in the Danube led to the recommendation that, in the long term, all states in the Black
Sea Basin should:
"take measures to reduce the loads of nutrients and hazardous substances to such
levels necessary to permit Black Sea ecosystems to recover to conditions similar to
those observed in the 1960s".
It was agreed, however, that "as an intermediate goal, urgent control measures should be taken
by all states in the Black Sea Basin in order to avoid that the discharges of nutrients (and
hazardous substances) into the Sea exceed those which existed in 1997". In the short term, the
Working Group identified the actions required to attain this as:
(i)
Reform of agricultural policies.
(ii)
Improvement of wastewater treatment (including the use of alternative low cost
technologies).
(iii)
Rehabilitation of essential aquatic ecosystems.
(iv)
Changes in consumer practice (targeted specifically at the use of phosphate-free
detergents).
The Working Group also recommended that a review of progress be undertaken in 2007 to focus
on further measures required to meet the long term objective of reaching an ecological status
similar to that observed during the 1960s (Joint ad-hoc Technical Working Group ICPDR �
ICPBS summary report, June 1999).
2
1.3 GEF nutrient reduction programme
The main objective of the GEF Nutrient Reduction Programme for the Black Sea is to assist in
implementing the practical measures for restoring and protecting the Black Sea environment.
The coastal countries agreed this in the 1996 Strategic Action Plan (SAP) for the rehabilitation
and Protection of the Black Sea. The key issues to be addressed under the GEF are in direct
support of the recommendations of the Joint ad-hoc Working Group of the ICPBS and the
ICPDR.
As a component of the GEFs basin-wide Programmatic Approach to the Black Sea, the proposed
programme is aimed at helping the Black Sea countries to develop and implement action plans to
prevent and remedy nutrient releases, through a combination of:
� Development, reform and enforcement of environmental policy and legislation.
� The application of economic instruments.
� Strengthening public participation in nutrient reduction.
� Monitoring of trends and compliance for nutrient reduction goals.
Assisting the countries to implement these necessary measures is the main objective of the
proposed GEF Black Sea Basin Programmatic Approach, which consists of the following two
basic components:
(i)
A "Strategic Partnership" to prepare country level investment projects for
nutrient reduction under the leadership of the World Bank.
(ii)
GEF Regional Projects (Danube and Black Sea) to support regional co-
ordination, capacity building and policy, legal and institutional reforms for
nutrient reduction. These will be jointly implemented by the three GEF
implementing agencies under the leadership of UNDP
Through the World Bank/GEF Strategic Partnership, projects will be identified which will make
a significant contribution to the control and/or abatement of nutrient discharges to the Black Sea.
It is assumed that all national, priority environmental investment projects are identified in NBS-
SAP and NEAPs.
The foremost criteria in project selection for GEF funding, which is obligatory, is that only
incremental costs will be covered. An environmental project, whatever its form will have two
components; a baseline cost, which relates to improvements needed to address national impacts,
and an incremental cost, which relates to improvements to address regional impacts. However, in
many cases, the incremental component is so small as to be negligible. The proportion of
incremental to baseline cost of any one project will depend upon the category to which
incremental benefits are assigned. The level of incremental cost has to be calculated on a project
by project basis because of these variables, involving complex economic analyses. The level of
work required to calculate `exact' incremental costs for every project would be too involved and
time consuming for an initial project selection stage and therefore a simplified methodology
based possibly on generic project types is proposed to be developed as a guide to help in project
selection.
The two regional projects are proposed to strengthen the respective Secretariats on all aspects of
nutrient reduction issues. A PDF- Block B grant has been allocated in early 2000 for the purpose
of preparing the Black Sea Regional Project. The regional benefit of the PDF grant is to establish
3
the regional and the national structures needed for the management and full implementation of
the Nutrient Reduction Programme in the Black Sea. A regional structure is required in order to
co-ordinate the country ac tivities in general, ensure consistent and prioritised National Action
Plans (NAPs), ensure liaison among the GEF partners (WB, UNDP and UNEP), and the national
governments, competent national bodies, national and regional institutions and NGOs.
The PDF provides financial assistance with respect to the strategy for nutrient reduction, by
providing:
(i)
Provision for the formation of national inter-ministerial committees responsible for issues
of nutrient use and control.
(ii)
Technical support to national and regional bodies for the formulation and implementation
of policy and legislation with respect to nutrient discharge and control in the Black Sea
region. This includes the development of draft nutrient reduction plans (national and
regional) for implementation over the next five years (Sections 2-7 of this report).
(iii)
Technical support to develop process, stress reduction and environmental status
indicators to determine the effectiveness of the strategies employed for nutrient reduction
(Parr and Reynolds 2000).
In order to bridge legal and political issues relating to the function of the existing conventions
and the two Commissions, the GEF are funding as part of the PDF, a `Memorandum of
Understanding' between the ICPBS and the ICPDR on common strategic goals. The
Memorandum of Understanding will not however constitute a legal document for the joint
implementation of issues relating to pollution control within transboundary waters and the wider
basin. The draft document provides the following strategic goals:
(i)
A long-term goal of nutrient reduction (and hazardous substances) to a level that will
allow the ecosystem to recover (1960s level).
(ii)
An intermediate goal not to exceed levels of nutrients (and hazardous substances) above
levels encountered in 1997.
(iii)
To reach agreement on a common approach to monitoring, including sampling and
QA/QC procedures.
(iv)
To further assess the nutrient (and hazardous substances) input loads and the ecological
status of the Black Sea and the Sea of Azov.
(v)
To adopt strategies FOR economic development which are in line with optimal
ecosystem functioning.
(vi)
To adopt strategies to control the discharge of nutrients and hazardous substances, with
review in 2007.
1.4 Eutrophication
The definition of eutrophication that now receives the greatest attention in EU Member States is
the version laid down in the Nitrates and Urban Wastewater Treatment Directives, viz:
"the enrichment of water by nutrients, especially compounds of nitrogen
and/or phosphorus, causing an accelerated growth of algae and higher plant
life to produce an undesirable disturbance to the balance of organisms
present in the water and to the quality of the water concerned."
4
This has resulted in the underlying causes of eutrophication recently being considered only in
terms of excess nitrogen or phosphorus (even though the EU definition does not exclude other
nutrients).
Other workers have considered marine/estuarine eutrophication in terms of nitrogen and
phosphorus (and sometimes silicate), while admitting that distinguishing between the impacts of
N and/or P enrichment and organic enrichment is very difficult, if not impossible. This is the
reason for a further group of scientists proposing trophic classification schemes for tidal
ecosystems based on organic carbon supply.
The problem stems from the fact that organic loading can be due to:
(i)
Increased growth of algae and higher plants which, in turn, contributes to
increased water column BOD levels. Upon death, these plants also increase the
sediment oxygen demand.
(ii)
Increased organic loading from external sources, e.g. direct discharges into the
marine environment via outfalls and fluvial fluxes.
Thus, even if external organic loads do not increase, providing external loads of N and P
increase, the organic load generated within a waterbody is likely to increase. However, while it is
relatively easy to monitor external loads of N and P, external organic loads are very much more
difficult to monitor, since a greater proportion of the organic loads is associated with sediment
bed-load than it is for nutrients.
Thus in the Black Sea `Indicators' report (Parr and Reynolds 2000), eutrophication was defined
in terms of the biological expression of excessive N and/or P levels (primarily in terms of
increased plant growth), albeit that animal indicators were discussed because of the oxygen-
depletion caused by increased primary productivity.
1.5 Nutrient cycling
To understand how a nutrient action plan aims to reduce eutrophication as a threat to the Black
Sea (or any other waterbody), it is necessary to have a basic understanding of:
(i)
The major nutrient sources.
(ii)
The routes of entry into aquatic ecosystems.
(iii)
How, once in surface waters, nutrients exert their effects and are recycled.
Parr and Reynolds (2000) present a summary of this information, but it is important to recognise
the full scale and complexity of anthropogenic influence on nutrient cycling. For example,
improving a WWTP to full efficiency with secondary level treatment will remove some 30% of
the nutrient (N&P) load and perhaps some 90% of the BOD load entering that plant. The
remaining 70% of nutrients and 10% of BOD will still be discharged to river. Unless the WWTP
is equipped with a denitrification stage, the majority of N and P removed from the raw sewage
will be converted into sewage sludge, and may be disposed of in several ways:
(i)
Placed in a landfill (together with solid municipal waste), from where much of it may
leach out and reach surface waters at a later date.
5
(ii)
Incinerated, in which case some of it will be returned to earth as atmospheric deposition
and then be transported to surface waters via runoff/leaching
(iii)
Used as organic fertiliser, in which case the majority will be taken up by plants, but some
will still reach surface waters via runoff/leaching.
(iv)
Stored in sites above ground from where nutrients may runoff/leach into freshwaters,
particularly following storm events.
This example fails to consider what proportion of nutrients used by urban communities and
industry are discharged to sewer, and how much of the nutrient load discharged to sewer is
transported to the WWTP. A large proportion may be lost to soil/groundwater if the sewerage
system is in a poor state of repair. While it is not practicable to control the nutrient content of
human faeces, it is possible to regulate against the elevated phosphorus content of detergents,
which may contribute one -third to one -half of the phosphorus content of domestic wastewater.
Moreover, it is also possible to regulate against the discharge of excessive industrial nutrient
loads to sewer by promoting lower usage of nutrients by industry, more efficient use of nutrients
within industrial processes (including improved recycling techniques) and improved pre-
treatment of wastewater before discharge to sewer. Lowering the heavy meta l content of
industrial wastewaters also allows a higher proportion of the sewage sludge generated to be
utilised as an organic fertiliser.
Of the nutrients that reach surface waters, much is made of the natural self-purification
properties of aquatic ecosystems, particularly wetlands and lakes/reservoirs. These clearly act as
nutrient sinks for some time, but cannot be relied on in the long-term, since they become
saturated with nutrients. While nitrogen can be lost to the atmosphere via denitrification,
phosphorus either remains in the water, accumulates in the sediment (from where it can be
released back into the water column) or is sequestered within animals/plants. The aquatic
ecosystems themselves become degraded with time, and biodiversity is drastically reduced.
Indeed, this what has happened (and continues to occur) within the Black Sea itself.
With regard to agriculture, there is clearly a requirement for cost-efficient arable production to
make the industry economically viable. This means mainta ining soil nutrient levels at an
optimum level: too low and crop yields will be poor; too high and excess nutrients will runoff
into surface waters or leach into groundwaters, from where they will eventually be transported to
surface waters. Leaching into coastal aquifers (especially of nitrate) may be a particular problem,
since this is originally a terrestrial source, which is not recorded by river flow/concentration
monitoring. Submarine freshwater springs (akin to baseflow in rivers) may contribute a la rge
proportion of the land-derived nutrient load to coastal, shallow areas of the marine environment -
exactly those regions of the Black Sea which are most sensitive to nutrient-enrichment.
To maintain soil nutrient nitrogen content at an appropriate level, a suitable estimate of how
much nitrogenous fertiliser is required can be based on the growing requirement of the crop,
together with a knowledge of the previous crop(s) grown in that soil. For phosphorus, however,
the concentration in the soil (measured as Olsen-extractable P, or an analogous method) has to be
monitored on an infrequent but regular basis. Phosphorus fertiliser application rates should then
be based on the soil Olsen P level, together with the P requirements of the crop being grown.
Recycling of nutrients within agriculture is extremely important, with as much fertiliser as
possible being supplied in an organic form. Thus, mixed arable/livestock farms or mixed
arable/livestock areas offer better livestock waste recycling opportunities because of the high
cost of transporting animal manure and slurry large distances from where they are produced. In
6
intense livestock areas, if all of the waste produced is applied to land, the soils become nutrient-
saturated and increased nutrient export oc curs.
In terms of economic instruments, experience in western Europe and the USA has shown taxes
on commercial inorganic fertilisers to have weak incentive effects, while the taxation of on-farm
nutrient surpluses appears to have considerable advantages (see Parr and Reynolds 2000).
However, major infrastructural change and investment would be required to introduce the
advice, help and enforcement required to introduce on-farm nutrient plans as a basis for
economic instrument development. This investment is worthwhile in terms of environmental
protection, but is best introduced over a long period, and only when the economy can support
such changes. Thus, the introduction of on-farm nutrient budgets/balances cannot be introduced
as part of any of the national plans, but should be considered as a long-term aim.
The take-home message of this section are that the major aims of any nutrient
control programme should be: (i) to minimise the import of nutrients into
catchments; (ii) to promote more conservative use of nutrients (greater recycling)
within those catchments; and (iii) to minimise the export of nutrients from
catchments.
Improved nutrient treatment facilities are only one method of helping to achieve aims (ii) and
(iii).
1.6 The way forward
A review of nutrient-related legislation, policies and practices in Black Sea riparian countries
was completed in June 2000 (Parr et al 2000). This showed legislation to vary greatly between
the six coastal counties, both in terms of the amount of legislation and its complexity. In most
countries, nutrients are regarded as simply another pollutant, with little legislation designed
specifically to tackle or prevent eutrophication, while in others, nutrient pollution is given a
much higher priority. Nevertheless, in all countries it was apparent that the costs of enforcement
of current legislation could not be met by the state. It is clear from this review that unless further
funding of national enforcement agencies (and their administrative/scientific back-up) is
forthcoming, then the full success of any nutrient action plan is extremely unlikely. It was
strongly recommended by Parr et al (2000) that the polluter pays principle be further employed
to reduce State costs of enforcement.
Fines for nutrient pollution should be set at an appropriate (index-linked) level to discourage
further pollution in the future and funds raised from the successful prosecution of polluters
should be channelled back into the regulatory regulations to pay for staffing and additional costs.
Greater use of the courts, together with a central record of all prosecution cases (successful or
otherwise) is to be encouraged. Similarly, a review of funding of regulatory monitoring should
be undertaken (in some countries this is currently happening) to promote the polluter pays
principle.
A system of increased self -monitoring by dischargers (preferably using composite samples rather
than spot samples) offers considerable advantages over current practices in some countries, with
greater regulatory age ncy involvement in QA/QC. Where possible, discharge consent conditions
should be based on chemical loads (not concentrations). The revision of consent conditions
should involve all interested parties.
7
This approach, together with the following sector-specific recommendations were made to
provide the basis of the six National Nutrient Action Plans (Sections 2-7):
Municipalities. Review/revise discharge consent conditions and consent compliance data for
WWTPs. Improve specifications for the development/construction of future landfill sites.
Improve prosecution rates for illegal dumping of waste. Increase the use of sewage sludge as an
organic fertiliser, particularly for forestry.
Industry. Review/revise conditions for trade waste discharge to sewer and direct discharge to
surface waters. For the food processing/chemical industries, discharge consent conditions should
include limits on total P, total N and total ammonia. Where appropriate, industrial discharge
consents should include heavy metal conditions. For discharges containing high levels of toxic
substances, COD consent conditions should be applied in addition to/instead of BOD conditions.
Agriculture. Develop guidance and educate farmers on cost-effective fertiliser application levels
for different crops. This guidance should be for total (organic and inorganic) nutrient application
rates, so should include advice on estimating the nutrient content of livestock manure. The
guidance should promote the use of organic fertiliser and the development of mixed
livestock/arable farms. Where possible, develop maximum livestock density norms for farms,
dependent on waste handling/disposal strategies. Provide advice/education to farmers on good
agricultural practice to minimise land erosion.
Forestry. Develop and implement a strategy for sustainable development of forestry.
Monitoring the success or failure of any major investment programme and institutional reform is
necessary to ensure that the future selection of actions/investments is improved. In order to do
this, currently available information should be used to develop indicators of process and stress
for nutrient use/export from the agricultural, industrial and municipal sectors (such indicators
were discussed at a stocktaking meeting on 28-29 June 2000 in Istanbul).
An environmental monitoring programme should be designed and undertaken (see Parr and
Reynolds 2000), the results from which should be used to develop environmental stress
indicators. Indicator targets should be developed and compliance with these targets assessed in
annual status reports, using compliance to monitor the success of the National and Regional
Action Plans. As required, the success of the Regional Plan should be reviewed on both a
national and sectorial basis and, where necessary, amendments should be made.
8
2.
BULGARIAN NATIONAL NUTRIENT ACTION PLAN
2.1 Immediate objectives, priority sub-objectives, measures and
activities for nutrient reduction
Inter-ministerial co-ordination and Government/NGO co-operation is important. Close co-
operation with local communities and with other stakeholders groups is needed for the
implementation of river basin management and nutrients control and reduction.
The following immediate objectives were identified based on the analysis of the current status of
Nutrient Reduction in Bulgaria and the barriers to nutrient related legal and policy reform:
Develop policies, legal instruments and measures for nutrient reduction.
Promote institutional strengthening and capacity building.
Strengthen public participation in nutrient export control.
To achieve these objectives, priority actions consisting of measures and activities are outlined
below:
2.1.1 Enact and enforce Water Law
� Develop and enforce River Basin management plans for Danube River Basin and for Black
Sea catchment area.
� Develop and enforce a new tariff system for water use and effluent discharges.
� Introduce self-monitoring of wastewater quality by municipal WWTPs and Industry.
2.1.2 Draft secondary legislation for adoption and enforcement under the Water Law
� Further develop and enforce effluent limits/emission standards.
� Adopt and enforce a Regulation on "protection of water from pollution with nitrates from
agricultural origin".
� Develop and enforce a revised permitting system for point sour ces discharges based on
pollution loads.
� Strengthen control of industrial wastewater quality for discharge to the sewer.
9
2.1.3 Strengthen acting Regulation No 3 for permissible limits of harmful substances in
the soil
� Improve soil conservation measures.
� Include norms for the phosphorus status of soils using Olsen-extractable phosphorus and the
phosphorus saturation index.
� Improve monitoring of the phosphorus status of soils using Olsen-extractable phosphorus and
the phosphorus saturation index (PSI).
2.1.4 Further develop and implement the national strategy for nutrient control
2.1.5 Develop/adapt methodology to assess non point sources of pollution
� Build national database of nutrient-related information/monitoring results.
2.1.6 Improve and upgrade existing water and soil monitoring systems
� Develop a monitoring system (quantity & quality) of leachate from solid waste disposal/
landfill sites and from manure storage/composting facilities.
� Develop a land/coastal erosion monitoring system and quantify the causes of erosion. Use
results to help guide the national strategy for nutrient control (Section 2.1.4).
� Improve the Black Sea monitoring system to include biological, chemical and physical
parameters (Parr and Reynolds 2000).
� Improve inland river monitoring systems (along the tributaries of the Danube River and Black
Sea) to expand the water quality sampling and flow gauging programmes.
2.1.7 Continue to develop and apply a geographic information system to support and
facilitate the management process
� Link with the GIS system (Section 2.1.5).
2.1.8 Continue to implement the National Programme for Priority Construction of Urban
WWTPs for settlements with over 10,000 po pulation equivalent in Black Sea
Catchment
2.1.9 Continue to implement the National Plan for the Development of Agricultural and
Rural Areas
10
2.2 Institutional strengthening and capacity building
2.2.1 Continue to implement river basin management
� Increase application of "polluter pays" and "users pays" principles in all sectors (munic ipal,
industrial and agricultural).
� Establish operational River Basin Councils for both basin districts.
� Establish a centre in Veliko Tarnovo to train personnel from stakeholder groups on river basin
management and nutrient control.
� Co-ordinate and monitor activities on river basin, national and international (Black Sea
catchment) levels.
2.2.2 Develop and enforce guidelines to implement measures in all sectors for nutrient
� Develop and enforce good agricultural practice guidance, including: guidelines on fertiliser
(organic & inorganic ) application rates; crop rotation; and develop legislation on minimum
specifications for manure storage facilities to prevent application of manure/slurry on
snow/frozen ground.
� Develop guidelines/framework for river basin management.
� Develop standard procedures for estimating/validating sectorial and national nutrient budgets.
2.2.3 Improve operation of inter-ministerial committees for nutrient control and
reduction
2.3 Public participation in nutrient reduction
2.3.1 Promote public awareness campaigns
� Produce annual publications on nutrient control initiatives to: improve the quality of the Black
Sea; stimulate economic recovery of coastal communities; and provide a sound basis for
agricultural development.
� Produce sector-oriented posters and brochures to promote nutrient control.
� Undertake periodic media campaigns related to nutrient control.
2.3.2 Establish an NGO lobby for nutrient reduction
� Identify relevant NGOs.
11
� Organise workshops and meetings to develop NGO and public support.
� Develop an action plan to participate in implementing the national nutrient action plan.
2.3.3 Conduct sectorial demonstration projects
� Develop regional agri-environmental schemes for sustainable development and efficient
management of agricultural activities (including organic agriculture, manure storage, erosion
control etc.)
� Undertake pilot projects to demonstrate alternative methods of domestic wastewater
treatment in the small towns and villages (e.g. construction of artificial wetlands).
� Undertake pilot projects to determine the capacity of restored wetlands as nutrient "sinks".
� Establish projects to predict the effect of changes in legislation on consumer practices
(including introduction and use of phosphate -free detergents).
2.4 Projects ready for implementation in the coming 5 years
The name, type, location and main characteristics of the identified projects ready for
implementation in the coming 5 years are shown in Table 2.1.
Table 2.1
Priority projects ready for implementation - anticipated nutrient reduction
after WWTP completion (the National Programme up to the year 2005)
Settlement, Industry, Resort, complex
Population BOD5 - t/year N - t/year
P - t/year
1
Shabla After WWTP (season )
5,500
30
18
1.80
2
Rusalka After WWTP (season)
1,500
9
9
2.50
3
Kavarna seson After WWTP (season)
15,000
5
5
0.70
(out of season)
11,811
9
9
1.20
4
Balchik After WWTP (season)
25,000
14
14
1.80
After WWTP (out of season)
7
7
0.98
5
Albena After WWTP
15,000
9
9
1.20
6
Zlatni Piasatzi After WWTP
14,000
7
7
1.00
7
St. Konstantin and Elena (season)
4,000
2
2
0.30
After WWTP (out of season)
2,000
2
2
0.30
8
Varna After WWTP
350,000
59
59
3.90
9
Asparuhovo After WWTP
26,600
59
59
3.90
10 Devnia and others After WWTP
26,000
55
55
3.70
11 "SODI" & "Agropolihim"
299
898
149.00
12 Kamchia After WWTP
25,000
10
10
1.25
12
Table 2.1... continued
Settlement, Industry, Resort, complex
Population BOD5 - t/year N - t/year
P - t/year
13 Obzor
Biala
After WWTP (season)
15,000
6
6
0.40
After WWTP out of season
5,300
5
5
0.30
14 Ravda-Sunny beach - Nesebar
After WWTP (season)
65,000
63
63
4.20
After WWTP (out of season)
5,000
5
5
0.30
15 Elenite After WWTP
5,000
5
5
0.40
16 Pomorie After WWTP
20,000
44
44
2.90
17 Vinprom Industrial WWTP
12
12
0.50
18 Burgas After WWTP
195,255
340
340
25.00
19 Neohim After WWTP
226
226
23.00
20 Zaharni Zavodi-Kameno
16
16
1.30
21 Meden rudnik
57,000
55
55
5.00
22 Chernomoetz (season)
25,000
141
29
6.70
23 Sozopol After WWTP (season)
20,000
11
11
1.40
After WWTP (out of season)
4,195
4
4
24 Duni (season)
2,000
10
10
1.00
25 Primorsko - Kiten -(season)
37,500
14
14
0.90
(out of season)
3,440
11
11
0.80
26 Lozenetz After WWTP (season)
1,500
3
3
0.20
27 Tzarevo After WWTP (season)
16,650
9
9
0.60
out of season
6,358
7
7
0.30
28 Ahtopol After WWTP (season)
11,550
5
5
0.60
(out of season)
1,256
1
1
0.20
29 Sinemoretz (season)
8,000
36
7
1.00
(out of season)
500
5
1
0.10
30 Sredetz
9,787
274
274
0.80
31 Targoviste
39,892
1,699
269
36.50
32 Veliki Preslav
10,624
35
35
4.20
33 Shumen
105,980
2,740
672
96.80
34 Smiadovo
4,617
101
55
3.70
35 Dalgopol
5,129
116
21
4.00
36 Kotel
8,100
14
14
1.90
37 Kaspichan
3,501
95
18
6.40
38 Novi Pazar
14,063
490
60
11.00
39 Provadia
18,060
412
79
13.90
Total
7,581
3,546
429.83
2.5 Investment framework
The main source for financing of capital investment for construction of the sewerage network
and municipal WWTPs is the National Budget. A further source is the National Environmental
Protection Fund (NEPF), which provides grants to municipalities for construction of priority
WWTPs and sewerage systems. The NEPF also provides preferential credit terms for private
firms wishing to construct their own WWTPs.
13
The National Eco-Trust Fund also provides grants for construction of the priority sewerage
networks and WWTPs, but only in the Danube River Basin and the coastal Black Sea catchment
where there are perceived benefits in terms of biodiversity and nature conservation.
The State Fund for Agriculture provides preferential loans aimed at supporting agricultural
producers, mainly for production of wheat, maize, sunflower and sugar beet. Most of the support
is granted in the form of short-term credit paid directly to farmers and repayable at harvest time.
The programme enabling farmers to buy fertilisers at subsidised prices has been discontinued,
but farmers remain exempt from profit tax and are not obliged to pay VAT on equipment
purchases. Import duties on pesticides, agricultural machinery and other farm inputs have also
been reduced.
An agreement has been signed between the Ministry of Environment and Water, and the
Ministry of Agriculture and Forests. This provides joint financial support for farmers (through
the State Fund for Agriculture and the NEPF) to implement agri-environmental plans, especially
in mountainous regions of the country.
Other sources for financing the capital investments for nutrient control are EU pre -accession
funds, such as ISPA and SAPARD.
There are a number of funding sources available for pollution/nutrient reduction, but these
sources are insufficient to meet the goals in the given time framework.
14
3.
GEORGIAN NUTRIENT ACTION PLAN
The Georgian Nutrient Action Plan is divided into 4 sections, aimed at improving:
� National nutrient-related legislation and policy (Section 3.1).
� Sectorial nutrient-related policy (Section 3.2).
� Institutional and human capacity to control nutrient export (Section 3.3).
� Public support and stakeholder involvement (Section 3.4).
This draft Nutrient Action Plan is summarised in Table 3.1, together with relevant actions from
the Georgian National Environmental Action Plan (NEAP; adopted on 20 May 2000).
3.1 Nutrient-related legislation and policy
3.1.1 Harmonisation with EU environmental legislation
� Undertake gap analysis with regard to the EU legislation.
� Develop strategic plan to harmonise Georgian/EU environmental legislation.
3.1.2 Improve water-related legislation
� Complete National Environmental Finance Strategy for the water supply and treatment
sector.
� Develop proposal for institutional reform of water supply and treatment systems
(introduction of privatisation elements, elimination of "hidden" subsidies, reconsideration of
tariff setting system, etc.).
� Undertake pilot project on institutional reform of water supply and treatment sector.
3.1.3 Improve legislation on agrochemicals (including inorganic fertilisers and pesticides)
� Develop a national system for agrochemicals licensing.
� Develop the Regulation on agroc hemicals labelling.
� Develop the Regulation on import/export of agrochemicals
� Develop the Regulation on State registration and examination of agrochemicals.
� Develop guidelines on storage, transportation, sale and safe use of agrochemicals in forestry
and agriculture.
3.1.4 Improve waste management legislation
� Develop the Law on Wastes.
� New regulation on landfills.
� Develop Regulation on the use sewage sludge.
.
3.1.5 Develop legislation on detergents
� Regulate the phosphorus content of detergents.
15
3.1.6 Implement changes in national Tax Code
� Revise existing taxation rates for N and P discharges.
� Develop mechanism to increase fines and penalties for non-permitted discharges of
pollutants.
3.1.7 Economic mechanisms
� Introduce progressive taxation of P in detergents.
� Develop the Law on Eco-labelling.
3.1.8 Water quality standards
Develop schedule for harmonisation of Georgian/EU standards.
3.2 Sectorial policy
3.2.1 Adjust local/regional development plans
� Introduce nutrient reduction component into national ICZM programme.
� Assess the conservation importance and nutrient reduction capacity of western Georgian
wetlands.
3.2.2 Improve municipal nutrient policies
� Rehabilitate Batumi WWTP; undertake feasibility study on installation of tertiary treatment.
� Construct WWTP and improve sewerage system in Kobuleti.
� Rehabilitate Zestaphoni WWTP at river Kvirila.
� Rehabilitate Kutaisi WWTP; undertake feasibility study on installation of tertiary treatment.
� Construct WWTP and improve sewerage system in Poti.
� Assess the condition/operational capacity of Sukhumi WWTP; develop immediate action
plan.
� Assess the condition/operational capacity of Gagra -Bichvinta WWTP; develop immediate
action plan.
� Assess the condition/remaining capacity of Batumi landfill; develop immedia te action plan.
� Assess the condition/remaining capacity Poti landfill; develop immediate action plan.
� Undertake pilot study on the use of sewage sludge use as a forest fertiliser.
� Enact buffer ("sanitary") zone regulations.
3.2.3 Industry
� Introduce N and P load limits into the discharge permitting process for selected enterprises.
� Introduce self-monitoring practices at major point sources nutrient discharges.
16
3.2.4 Agriculture
� Develop guidance for farmers on fertiliser application levels.
� Develop guidance for farmers on manure treatment and application.
� Develop advice to reduce soil erosion.
� Undertake pilot project on the adoption of good agricultural practice.
3.2.5 Improvement of forestry strategy
� Develop a nutrient reduction strategy and include in best practices guidance for forestry
sector.
3.3 Institutional and human capacity
3.3.1 Improvement of MENRP capacity
� MENRP local/regional offices capacity-building, including institutional reform.
� Develop MENRP internal manuals on nutrient reduction regulations and procedures.
3.3.2 Strengthen data gathering/processing system to support decision making
� Develop national inventory on nutrient release and transfer from all sources (including
atmospheric deposition); produce a list of key point sources.
� Establish a national Coastal Environmental Quality Monitoring & Information System.
� Develop an inventory of fertiliser sales and outdated stockpiles.
� Develop a Regulation on monitoring nutrient export from solid waste landfills.
� Develop self -monitoring guidelines for enterprises.
� Identify/develop nutrient export indicators.
3.3.3 Improve co -ordination between governmental agencies
3.3.4 Develop local expertise in nutrient control options
� Establish a training programme/seminars at the MENRP for local enterprises.
3.4 Public support and stakeholder involvement
3.4.1 Improve public information and public awareness
� Introduction a chapter on nutrients in the annual "State of the Environment" report.
� Establish a nutrient-oriented module at the public education centre in Batumi.
3.4.2 Public participation
� Establish local councils on sustainable development in coastal regions; undertake at least one
pilot project to determine the best methods of improving public support and stakeholder
involvement.
17
Table 3.1
Draft Georgian nutrient action plan
List of abbreviations used in table:
MENRP � the Ministry of Environment and Natural Resources Protection of Georgia
MoH � Ministry of Health and Social Protection
MoA � Ministry of Agriculture and Food
MoUC � Ministry of Urbanisation and Construction
MoF � Ministry of Finance
MoEc � Ministry of Economics, Industry and Trade
MoSPM � Ministry of State Property Management
MoTR � Ministry of Tax Revenues
SDoF � State Department of Forestry
SDoS � State Department of Standardisation, Metrology and Certification
Action
Starting Closing Activity
Responsible Agency
Other Parties Involved
No.
date
date
1
2000
2000
Preparation of feasibility study for the project for amelioration of
MENRP
Ministry of
Kutaisi water supply system. (NEAP action.)
Urbanisation and
Construction; TACIS;
Ministry of Health and
Social Protection
2
2000
2000
Study of efficiency of environmental taxation (environment pollution
MENRP
Ministry of Finance;
tax, natural resources tax), recommendations for introduction of
TACIS
amendments and additions to the Tax Code. (NEAP action.)
3
2000
Implementation of the programme for institutional strengthening of the MENRP
UNDP; Dutch
MENRP. (Started 1999.) (NEAP action.)
government
4
2000
2000
Enactment of the law and regulations on waste management, to tackle
Parliament of Georgia MENRP; Ministry of
the problem of handling (classification, transportation, disposal,
Health and Social
recycling) of waste. (NEAP action.)
Protection
18
19
Table 3.1... continued
Action
Starting Closing Activity
Responsible Agency
Other Parties Involved
No.
date
date
5
2000
2001
Setting up the project preparation unit (PPU) within the MENRP. This
MENRP
will be to identify and co-ordinate preparation of environmental
projects for submissio n to international financial organisations, funds,
donor countries. Assistance of the donor country in training of local
personnel, logistical and other support is possible. (NEAP action.)
6
2000
2001
Composing water cadastre for surface water licensing. (NEAP action.)
MENRP
Giprovodkhoz Institute
7
2000
2002
Execution of programme for encouraging introduction of
MENRP
Ministry of Industry;
environmental management standard systems (e.g. ISO 14001,
Sakstandarti
EMAS). (NEAP action.)
8
2001
2002
Preparation of investment projects envisioned by the Black Sea
MENRP
International financial
Rehabilitation and Protection Action Plan. Presentation of the projects
organisations, donor
to international financial organisations. (NEAP action.)
countries
9
2001
2002
Preparation of investment proposal for implementation of the pilot
MENRP
Ministry of Agriculture
project of the best agricultural practice. Submission of this proposal to
and Food; Ministry of
international financial organisations. (NEAP action.)
Health and Social
Protection; GEF
10
2001
2002
Study of the state of disposal of above expiry date agrochemicals and
MENRP
Ministry of Health and
mineral fertilisers available in Georgia. (NEAP action.)
Social Protection
Ministry of Agriculture
and Food
11
2001
2002
Elaboration of the programme for development of environmental
Ministry of Education MENRP
education, including that for foreign language schools in Georgia.
(NEAP action.)
12
2001
2002
Training of journalists dealing with environmental issues, setting up
MENRP
donor countries
training courses. (NEAP action.)
13
2001
2002
Preparation of investment project for recycling of municipal and
MENRP
Regional (local) self
industrial waste and its submission to international financial
governing agencies
organisations. (NEAP action.)
20
Table 3.1... continued
Action
Starting Closing Activity
Responsible Agency
Other Parties Involved
No.
date
date
14
2001
2004
Introduction of new standards for air, surface and drinking water
State Department of
MENRP; Ministry of
quality. (NEAP action.)
Standardisation,
Health and Social
Metrology and
Protection
Certification
15
2001
2004
Implementation of the project for rehabilitation of Kutaisi water
Ministry of
International financial
supply. (NEAP action.)
Urbanisation and
organisations
Construction
16
2001
2003
Preparation of environmental manuals and textbooks for preparatory,
Ministry of Education Tbilisi State University
secondary (including foreign language schools in Georgia), and high
schools. (NEAP action.)
17
2001
2002
Elaboration of the national strategy of environmental information.
MENRP
MENRP; International
(NEAP action.)
financial organisations.
18
2002
2003
Implementation of the pilot project in introduction of the best available Ministry of
GEF
practice in agriculture. (NEAP action.)
Agriculture and Food
19
2001
Development of the gap analysis in regard to the EU legislation
MENRP
MoH, MoA, SDoS
(including nutrients).
20
2002
Development of the strategic plan for harmonisation of Georgian
MENRP
MoH, MoA, SDoS
environmental legislation with EU environmental legislation.
21
2001
Completion of National Environmental Financing Strategy for the
MENRP
MoF, MoEc, OECD
water supply and treatment sector.
task Force
22
2001
Development of the proposal for institutional revision of water supply
MENRP
MoF, MoSPM, MoUC,
and treatment system (introduction of privatisation elements,
MoH
elimination of "hidden" subsidies, reconsideration of tariff setting
system, etc.).
23
2003
At least one pilot project for introduction of institutional changes in
Municipalities
MENRP, MoUC
water supply and treatment system.
24
2002
Development of national system on pesticides/agrochemicals licensing. MoH
MENRP, MoA
25
2002
Development of the regulation for pesticides and agrochemicals
MoH
MENRP, MoA, SDoS
labelling.
21
Table 3.1... continued
Action
Starting Closing Activity
Responsible Agency
Other Parties Involved
No.
date
date
26
2002
Development of the regulation for import and export of pesticides and
MoH
MENRP, MoA, MoF,
agrochemicals.
MoTR
27
2002
Development of the regulation for the State registration and
MoH
MENRP, MoA, SDoS,
examination of pesticides and agrochemicals.
GAoS
28
2002
Development of the guidelines for storage, transportation, sale and safe MoH
MENRP, MoH, MoA,
use of pesticides and agrochemicals in forestry and agriculture.
SDoF
29
2000
Development of the Law on wastes.
MENRP
MoH, SDoS, SAoS
30
2001
New regulation on landfills.
MENRP
MoUC, MoH
31
2001
Regulation on sewage sludge use.
MENRP
MoUC, MoH, MoA
32
2002
Regulation on the limitation of P content in detergents.
SDoS
MENRP, MoH, MoTR
33
2002
Revision of existing taxation rates for N and P discharges.
MENRP
MoF, MoEc, MoTR
34
2001
Development of the mechanism for increase of fines and penalties for
MENRP
MoF, MoEc, MoTR,
non-permitted discharges of pollutants.
SDoS
35
2002
Introduction of progressive taxation of P in detergents.
MENRP
MoF, MoEc, MoTR,
SDoS
36
2001
Development of the Law on Eco-labelling.
MENRP
SDoS
37
2001
Development of the schedule for harmonisation of the national water
MENRP
MoH, SDoS
standards with EU standards.
38
2001
Introduction of nutrient reduction component into national ICZM
MENRP
WB
programme.
39
2002
Assessment of the value of ecological s ervices provided by western
MENRP
Georgian wetlands.
40
2004
Rehabilitation of Batumi WWTP. Feasibility study for tertiary
MoUC
MENRP, Local
treatment introduction.
governments
41
2005
Construction of WWTP and improvement of sewage collection in
MoUC
MENRP, Local
Kobuleti.
governments
42
2004
Rehabilitation of Zestaphoni WWTP at river Kvirila.
MoUC
MENRP, Local
governments
22
Table 3.1... continued
Action
Starting Closing Activity
Responsible Agency
Other Parties Involved
No.
date
date
43
2003
Rehabilitation of Kutaisi WWTP. Feasibility study for tertiary
MoUC
MENRP, Local
treatment introduction.
governments
44
2005
Construction of WWTP and improvement of sewage collection in Poti. MoUC
MENRP, Local
governments
45
2002
Evaluation of the state of Sukhumi WWTP. Design of immediate
MENRP
actions.
46
2002
Evaluation of the state of Gagra-Bichvinta WWTP. Design of
MENRP
immediate actions.
47
2001
Assessment of Batumi landfill. Design of immediate actions.
MENRP
Local governments
48
2001
Assessment of Poti landfill. Design of immediate actions.
MENRP
Local governments
49
2004
Design of a pilot project for sewage sludge use as fertiliser in forestry.
SDoF
MENRP, MoA
50
2001
Enactment of buffer ("sanitary") zone regulations.
MoUC
MENRP, MoH
51
2001
Introduction of N and P load limits into discharge permitting process
MENRP
Enterprises
for selected enterprises.
52
2002
Introduction of self-monitoring practices at biggest point sources of
MENRP
Enterprises
nutrient discharge.
53
2002
Development of the guidance for farmers on fertiliser application
MoA
MENRP
levels.
54
2002
Development of the guidance for farmers on manure treatment and
MoA
MENRP
application.
55
2003
Pilot project on the introduction of good agricultural practices in rural
MoA
MENRP
communities.
56
2003
Development of the manual on combating erosion on agricultural
MoA
MENRP
slopes.
57
2002
Development of the nutrient reduction strategy and best practices for
MENRP
SDoF
forestry sector.
58
2002
MENRP local/regional offices capacity-building, including
MENRP
institutional changes.
23
Table 3.1... continued
Action
Starting Closing Activity
Responsible Agency
Other Parties Involved
No.
date
date
59
2001
MENRP internal manuals on nutrient reduction regulations and
MENRP
procedures.
60
2003
Setting up of the national inventory on nutrient release and transfer
MENRP
MoH, MoEc, MoA,
from all sources (including atmospheric deposition); accomplishment
SDoF
of the list of primary point sources.
61
2003
Establishment of National Coastal Environmental Quality Monitoring
MENRP
& Information System.
62
2002
Setting up of the inventory of outdated fertiliser stocks.
MoA
MENRP
63
2002
Development of the regulation for monitoring of nutrient load from
MENRP
MoUC, MoH
solid waste landfills
64
2003
Development of sectorial self-monitoring guidelines for enterprises.
MENRP
MoA, MoEc
65
2001
Development of system of nutrient reduction indicators.
MENRP
MoH, GAoS, SDoS
66
2002
Establishment of training/seminars courses at the MENRP for local
MENRP
MoEc
enterprises.
67
2001
Introduction of a special chapter on nutrients in annual "State of the
MENRP
Environment" report.
68
2002
Establishment of a special nutrient -oriented module at the public
MENRP
Local government
education centre in Batumi.
69
2003
Establishment of local councils on sustainable development in coastal
MENRP
Local government;
regions; at least one pilot project launched.
other stakeholders
24
25
4.
ROMANIAN NUTRIENT ACTION PLAN
4.1 General approach
In developing a priority action plan, four guiding principles have been taken into account:
(i)
Priorities and actions should be based on short duration environmental audits, taking into
account risk assessment.
(ii)
Where possible, nutrients control measures should be low cost (e.g. establishment of
buffer zones).
(iii)
Priority actions should be consistent with the overall environment strategy for Romania.
(iv)
Sub-actions have been considered as basic activities.
The priorities and timing of remedial actions are based on the following risk criteria:
� Severity of the effect of nutrients for the aquatic ecosystems.
� The extent to which the effect is reversible and the time scale for the effect to be reversed.
� The degree to which the problem is local or regional.
� The degree to which multiple sources contribute to nutrient pollution.
� Other non-risk based criteria include:
� the cost effectiveness of the proposal;
� public support and political viability;
� willingness to pay;
� the ability to achieve short term results;
� the economic impact of the environmental degradation; and
� the technical feasibility of control.
The resulting actions and timing are classed as follows:
Class A immediate : basic high priority actions required to reduce or stop nutrient discharges.
Class B short term (1-3 years): actions which are of less immediate priority than in class A
and/or which require some measure of planning and design.
Class C medium term (3-7 years): actions dependent on the outcome of the restructuring
process.
Class D long term (>7 years): actions of relatively low priority; usually with large investments
associated.
Based on a sectorial analysis 53 activities have been identified of which 7.5% are of class A,
22.7% belong to class B, 47.2% to class C and 22.6% to class D. Three main action packages
relate to: (i) legislation, (ii) institutional and (iii) investment actions. Group (i) and (ii) actions
are usually short-term and generate group (iii) actions for the medium and long-term.
In addition to legislative and institutional related activities there are two further types of action:
� Sectorial activities such as for industry and municipalities.
� Intersectorial activities where the leading role should be paid by MWFEP in the framework
of the inter-ministerial committee secretariat � NEAP (National Environmental Action Plan).
26
Support activities such as monitoring programmes (national) and self -monitoring (industry,
agriculture, municipalities) from which indicators can be derived are also essential to the success
of the national nutrient action plan.
The key actions are shown in Tables 4.1-4.4, with the class designation of each action shown in
parentheses. The following abbreviations are used:
MWFEP Ministry of Water, Forestry and Environmental Protection
MPW
Ministry of Public Works
MH
Ministry of Health
MAF
Ministry of Agriculture and Fisheries
MIT
Ministry of Industry and Transport
RW
Romanian Water (national water supply company)
BAT
Best Available Technology
BEP
Best Environmental Practice
Table 4.1
Key actions: legislation/institutional
No
Policy-Legislation-Institutional-
Responsi
200
200
2002
200
200
200
2006
0
1
3
4
5
Infrastructure (CLASS)
- bility
2010
1
Finalise the harmonisation process with
MWFE
P
the EU nutrient related legislation:
+
M P W
BAT/BEP implementation (C)
+ MH
+
1.1 Transposition of Directives MAF +
(B)
1.2 Implementation process (C)
MIT
1.3 EWFD Directive (C)
2
Introduce and develop an MWFE
effective
P
framework for water
+
management (C)
MAP+
2.1 Rive r Basin Authority + munici
Committee
pa
framework, responsibilities (B)
lities+
2.2 Integrated water/ land
RW
management
plans (C)
2.2. .Develop/implement
basin
WQS/ effluent standards
(N,P
conc./loads)
2.2.2 Development diffuse
pollution
management plan
2.2.3 Develop buffer zones
27
plan
2.2.4 Rehabilitate/protect
sensitive/
affected areas
2.2.5 Develop
environmental
monitoring programme
2.2.6 Water funds management
3
Promote targets for short and MWFE
medium term
P
nutrient load reductions (A)
3.1 Develop ambient water
quality
standards and effluent standards
(A)
3.2 Harmonise water quality
classification
scheme with other Danube River
basin
countries (B)
28
Table 4.1... continued
No
Policy-Legislation-Institutional-
Responsi
200
200
200
200
200
200
2006
0
1
2
3
4
5
Infrastructure (CLASS)
- bility
2010
4
Deve lop environmental MWFE
regulation for
P
waste management control ( B )
+MIT
4.1 Develop marketing +MAF
programme for
animal waste (B)
+MH
4.2 Develop norms for animal
farms/
complexes (A)
4.3 Develop norms/guidelines
for manure
disposal/application (A)
5
Develop a plan to reduce MAF+
agricultural
pollution and promote organic MWFE
farming (C)
P
5.1 Complete livestock + MH
inventory (B)
5.2 Control of inorganic
fertiliser
application (C)
5.3 Develop/implement eco-
labelling
scheme for agriculture products
(B)
6
Technical assistance/ training MWFE
(C)
P
+MAF
Table 4.2
Key actions: agriculture
No
Agriculture sector
Responsi
200
200
200
2003
2004
2005
200
- bility
0
1
2
6
201
0
1
Review current policies and
MAF
develop
+
integrated approach to water
MWFE
resources and
P
land management (A)
1.1 Introduce sustainable land
protection
programme (C)
1.2 Develop/implement plan to
minimise
land erosion (sustainable
forestry, buffer
29
zones, wetlands, flood plains
restoration
and protection (D)
1.3 Provide advice to control
nutrient run-
off/leaching from agricultural
sector (D)
2
Develop/introduce policy on MAF +
sustainable
agricultural production (D)
MIT+
2.1 Rehabilitate/extend animal MWFE
farm
P
WWTPs (B)
2.2 Promote
equipment/construction of
manure storage and spreading
facilities (C)
2.3 Pilot/ demo- projects of BEP
for use of
fertilisers ( B )
2.4 Market development for
livestock
waste (C)
2.5 Development of manure
management
(C)
2.6 Introduce agricultural eco-
labelling
(C)
30
Table 4.2... continued
No
Agriculture sector
Responsi
200
200
200
2003
2004
2005
200
- bility
0
1
2
6
201
0
3
Develop/implement monitoring
MAF+
programme for nutrient MWFE
application norms
P
compliance (D)
4
Training/ technical assistance, MAF+
guidelines
-catchment management MWFE
planning
P
-manure application / disposal
(D)
Table 4.3
Key actions: municipalities
No
Municipal sector
Responsi
200
200
200
200
200
200
2006
- bility
0
1
2
3
4
5
2010
1
Upgrade WWTP capacity (C)
Munici
pa
1.1 Improve operation and
lities+
maintenance of
existing WWTPs (B)
M P W
1.2 Apply appropriate sludge
treatment
and disposal (C)
1.3 Develop and implement
programme
for self-monitoring of effluents
(C)
2
Implement the Urban MPW+
Wastewater
Directive (D)
Munici
pa
2.1 Extend public sewer systems lities+
and
connected houses with public MWFE
water supply
P
to sewer system (D)
2.2 Strengthen/enforce
regulations and
standards for pre-treatment of
commercial/
industrial waste entering
municipal
sewerage systems (C)
2.3 Optimise operation and
maintenance of
31
sewerage systems (D)
2.4 Construct new WWTP;
extend
existing ones (D)
3
Implement programme for
MWFE
P
environmentally sound WW
treatment for
rural areas (D)
4
Develop plans for disposal of Munici
waste from
pa
barges and ships (C)
lities+
MT +
MWFE
P
5
Revise the fee and fine structure MPW+
to reflect
paying capacity of water users Munici
and WWTP
pa
costs (C)
lities
6
Ensure technical assistance/ MPW+
training (D)
MWFE
P
7
Improve public involvement (D) Munici
palities
32
Table 4.4
Key actions: industry
No
Industry sector
Remarks
200
200
200
200
200
200
2006
0
1
2
3
4
5
2010
1
Develop an institutional
MIT
framework to
implement BAT and BEP for
point and
diffuse source pollution C)
1.1 Undertake projects on
reconstruction
and modernisation (C)
1.2 Implement industrial waste
treatment
reconstruction/ modernisation
(C)
1.3 Develop self-monitoring
system for
consent compliance control (C)
2
Plan and construct low P MIT+
leachate landfills
(B)
MWFE
P
3
Introduce technology for
MIT
phosphorous-free
detergent manufacturing (C)
3.1 Introduce eco-labelling of
industrial
products (C)
4
Improve technical MIT+
assistance/training (D)
MWFE
P
4.2 Project identification
Many of the activities are likely to generate projects. These can be divided into: (i) hot spot
projects (Section 4.2.1); and (ii) general projects (Section 4.2.2).
4.2.1 "Hot spot" projects
Table 4.5 shows areas of high nutrient status in Romania and illustrates which sector(s) are the
major nutrient sources in these areas. Of these 30 hot spots 63% are considered to be high
priority. In 50% of cases, elevated nutrient levels and are due primarily to municipal pollution; in
30% of cases nutrient pollution is derived principally from agriculture and in 20% of cases the
excessive nutrient levels are due to industrial discharges.
33
Table 4.5
Nutrient "hot spots" in Romania
No
Name
Sector
Priority
Sub- basin area
1. Oradea
municipal
high
Tisa
2. Zalau Crasna I
municipal
high
Tisa
3. Zalau Crasna II
municipal
high
Tisa
4. Deva Mures
municipal
high
Tisa
5. Timisoara/ Bega municipal
high
Tisa
6. Timis I
municipal
high
Tisa
7. Timisoara/Bega
industrial
high
Tisa
8. Timis II
industrial
high
Tisa
9. Azomures Tg. industrial
medium
Tisa
10 Mures
agricultural
medium
Tisa
.
Integrate Arad agricultural
medium
Tisa
11 (food)
agricultural
medium
Tisa
.
Nutrimur Iernut - municipal
high
Jiu
12 Mures
municipal
high
Targului/
.
Consium Moftim
municipal
high
Arges
13 Avicola Satu Mare
municipal
high
Dambovita/
.
Agroconsuim
municipal
high
Arges
14 Bontida
municipal
medium
Dunare/
.
Craiova - Jiu
municipal
medium
Danube
15 Campulung Muscel
industrial
medium
Dunare/
.
Bucuresti
industrial
medium
Danube
16 Braila
industrial
medium
Olt
.
Galati
agricultural
high
Ialomita
17 Rm. Valcea
agricultural
high
Olt
.
Targoviste
agricultural
medium
Olt
18 Nitramonia Fagaras agricultural
medium
Olt
.
Romfosfochim
municipal
high
Vlasia/
19 Valcea
municipal
high
Ialomita
.
Tr. Magurele
agricultural
high
20 Peris
agricultural
high
Ialomita
.
Consuim Ulmeni
Danube
21 Combil Gh. Doja
Prut
.
Braigal Braila
Prut
22 Ungheni
Prut
.
Iasi
Bahlui Prut
23 Cantemir Tomesti
.
Suin Prod
24 Independenta
.
25
.
26
.
27
.
28
34
.
29
.
30
.
4.2.1 General projects
Each of the activities could generate associated projects, such as:
� Development of a methodology to quantify diffuse pollution.
� Nutrient bioavailability appraisal.
� Buffer zone demonstration projects, etc.
4.3 Cost estimation
Implementation costs are considered in relation to:
(i)
Harmonisation/implementation of EU environmental legislation.
(ii)
Operational costs to achieve the nutrient targets.
35
4.3.1 Costs related to the EU legislation approximation process
A recent Phare project (Water Strategy - MWFEP 2000). estimated that harmonisation of
Romanian and EU legislation concerned with water quality protection would cost some 3,440
mill. Euro for capital investment, with a further 316 mill. Euro operating and maintenance costs.
The most costly EU Directive to implement in Romania will be the Urban Waste Directive.
With regard to the National Environmental Action Plan 84 projects are concerned with sewerage
system extension and WWTP construction/upgrading at a total cost of some670 mill. Euro.
4.3.2 Cost related to the targets
The ICPDR Investment Programme costs for Romania are shown in Table 4.6: Considering that
most of the objectives of the ICPDR programme are shared with the Black Sea GEF Programme,
the 759 mill. USD could be considered as a suitable basis for estimating the cost(s) of the
Romanian Nutrient Action Plan implementation.
Table 4.6
ICPDR Investment Program costs for Romania
Municipal
Industrial
Agricultur
Wetlands
General
Total
(mil. USD) (mil. USD)
e (mil.
(mil. USD) (mil. USD) (mil. USD)
USD)
360
255
40
101
3
759
47.4%
33.6%
5.3%
13.3%
0.4%
100%
36
37
5.
RUSSIAN NUTRIENT ACTION PLAN
5.1 Measures related to municipalities
1.
Reduce the nutrient content of wastewater discharged to rivers, lakes and
coastal/estuarine waters a level that will allow self-restoration to occur.
2.
Eliminate discharges of polluted and insufficiently treated wastewater by means of:
� Treatment according to the established norms, if necessary by introducing tertiary
treatment processes.
� Collection and treatment of urban runoff.
� Re-using treated wastewaters.
3.
Develop dual 'dirty' water/urban runoff sewer systems and construct or upgrade current
WWTPs to treat the wastewaters collected. Improve domestic and industrial waste
collection and utilisation systems.
4.
Construct or reconstruct municipal sewer systems (for domestic and urban runoff) in the
settlements and towns of Rostov-on-Don, Taganrog, Azov, Novorossijsk, Tuapse,
Krasnodar, Gelendgic and Anapa.
5.
Where technically feasible, develop and implement a stage-by-stage transition of
processing industries and municipal services located in the coastal zone to a closed-type
water supply system. When it is not acceptable, construct WWTPs to prevent discharges
of untreated and insufficiently treated wastewater to water bodies.
6.
Reduce the nutrient load in wastewater from the city of Rostov-on-Don that enters the
river Don/Sea of Azov.
5.2 Measures related to agriculture
1.
Prohibit ploughing in coastal strips. Instead, promote afforestation of this land or its
conversion to meadows, together with a change to ecologically safe agricultural
technologies that provide soil protection and minimise mineral fertiliser application.
Transfer livestock farms, agr icultural aircraft airports, etc. outside water protec tion zones
and increase surface water protection from nutrients input to the environment.
2.
Optimise inorganic fertiliser application rates on agricultural lands.
3.
Utilise livestock farm wastes. Prohibit livestock farms construction with manure
hydroflush (slurry-based systems). Reconstruct existing farms to replace manure
hydroflush systems by dry methods of manure removal.
4.
Produce fodder albumen (protein) and other useful products from agricultural and food
industry wastes.
38
5.
Promote full use of the self-purification potential of natural ecosystems.
6.
Provide all land users with design-and-budget documents based on the adaptive-
landscape system of land cultivation. Issue passports on the pollutant status of lands.
5.3 Measures related to waste disposal and utilisation
1.
Construct plants and sites for wastes disposal and utilisation.
2.
Make facilities for treatment, decontamination and utilisation of harmful wastes,
compulsory at waste disposal sites.
3.
Develop a system to promote the collection, treatment and recycling of agricultural and
municipal wastes in coastal areas of the Black and Azov Seas.
4.
Utilise all harvested wood biomass to manufacture commercial products.
5.4 Measures related to normative, legal, institutional and scientific�
technical support.
1.
Improve the water management system to include an economic mechanism for water
resources use. Update environmental legislation to strengthen responsibility for aquatic
pollution, irrational use of water resources, non-compliance with regulations related to
the use of water protection zones, and unauthorised water use.
2.
Develop and introduce scientifically -based criteria for allowable nutrient impact on the
marine ecosystems.
3.
Restore the network of monitoring sites/observation stations and activities to control the
nutrient content of surface, ground and marine waters.
Specific priority measures for nutrient pollution load reduction in the Azov�Black Sea basin are
presented in Tables 5.1-5.3.
39
Table 5.1
Specific priority measures for nutrient pollution reduction in Krasnodar
Kraj
Measures
Dates
Ecological
Cost
effect
estimates
(thous. USD)
1.
Reconstruct emergency
2000�2005
Upgrading
786
sewage collectors and
wastewater
WWTP in Krasnodar
treatment
2.
Construct the third stage
2000�2005
� " �
4178
of the sewerage system in
Krasnodar
3.
Construct the 2nd stage of
2000�2001
� " �
590
the sewerage system in
Krasnodar
4. Reconstruct and enlarge
2000�2010
Improved
169642
municipal WWTP in
wastewater
Sochi
treatment
5.
Extend and reconstruct
2000�2010
� " �
19464
WWTP in Adler,
Dagomys, Vardane, on the
river Bzugn; collectors of
a pump station in Adler,
Loo, Dagomys, located in
the region of the health
resort Sochi
6.
Construct waste
2000�2003
Elimination of
189
processing/treatment
solid domestic
installations in
wastes,
Novorossijsk for sanitary
rehabilitation of
cleanin g of resorts in
the environmental
Anapa, Gelendgic and
situation
Novorossijsk
7.
Reconstruct the waste
2000�2005
Upgrading of
1982
incineration plant in
incineration
Sochi
technology
8.
Construct two solid
2000�2003
Disposal of solid
314
domestic wastes
domestic wastes
installations in Sochi
(settlements Lazarevskoje,
Adler)
9.
Eliminate unauthorised
2000�2005
Landscape
193
dumping sites and land
restoration/
restoration
elimination of
environment
pollution
40
Table 5.1... continued
Measures
Dates
Ecological
Cost
effect
estimates
(thous. USD)
10. Construct facilities and
2000�2004
Clean marine
1964
networks for storm water
waters within the
collection and discharge
beach zones and
in resorts on the Black
zones of marine
Sea and Azov Sea coasts
waters intake for
swimming pools
11. Restore damaged/ polluted
2000�2004
Improvement of
1214
soils in the area of a
the ecological
health resort S ochi
status of soils
12. Transfer livestock farms
2000�2009
Environmental
357
from slurry-based systems
improvement
to dry manure-based
systems; soil restoration in
impacted areas
13. Implement the Federal
2000�2003
Coastal protection
151750
programme for the Azov�
Black Sea coasts
protection against
dangerous natural
processes in the territory
of Krasnodar krai
14. Anti�landslide and coast
2000�2004
Coastal protection
5375
reinforcement works at
Sochi
15. Implement a programme
2000�2004
Forests restoration
1307
for compensational
and environmental
afforestation
improvement
Subtotal
359305
41
Table 5.2
Specific priority measures for nutrient pollution reduction in Rostov oblast
Measures
Dates
Ecological
Cost
effect
estimates
(thous.
USD)
16.
Third stage of the
2000�2003
Environmental
6553
enlargement and
improvement
reconstruction of the
sewerage system in Rostov
17
Second stage of enlargement
2000�2003
�"�
1560
and reconstruction of
sewerage system,
reconstruction of the 1st
stage of a sewage system in
Rostov-on-Don
18.
Domestic wastewater
2000�2002
�"�
114
collector in Rostov-on-Don
19.
Construct sewer system in
2000�2002
"�"
1254
Novocherkask
20.
Construct WWTP in the town
2000�2004
Treatment of
721
of Aksai
wastewater
discharged to the
River Don
21.
Construct biological WWTP
2000�2004
Wastewater
843
in the town of Salsk
treatment
22.
Sewerage system
2000�2004
Upgrading sanitary
678
reconstruction in
conditions in the
Konstantinovsk
territory
23.
WWTP reconstruction in
2000�2004
Elimination of
160
Proletarsk
untreated wastewater
24.
Combined WWTP
2000�2003
�"�
8164
reconstruction
25.
Municipal WWTP
2000�2005
Reduction of
4314
reconstruction in Taganrog
pollutant loads to the
shallow part of
Taganrog Bay
26.
Reconstruction of the main
2000�2002
Treated wastewater
711
sewage collector in Azov
discharge
27.
Coastal reinforcement
2000�2005
Coastal protection
9554
measures in the Taganrog
Bay
28.
Construct solid domestic
2000�2002
Improvement of the
7825
waste disposal facility for
sanitary and
Rostov-on Don
ecological state in
the town
29.
Flood prevention measures
2000�2003
Prevention of
7825
for the River Don delta
emergency situations
and decrease of
economic damage
Sub-total
50276
Total (Tables 5.1
409581
and 5.2)
42
Table 5.3
Measures related to legal, normative, institu tional and scientific -technical
support
Measures
Dates
Ecological effect
1. Develop and adopt the Law on
2001-
Regulation of social and
"Ecological safety of the s ocial-
2002
economic activities,
economic development of the coastal
stabilization of the
areas of the Black Sea and the Sea of
environmental situation
Azov"
2. Develop and adopt the Law on
2001-
Increase in the effective actions
"Responsibility for the damage
2002
of the state environmental
caused by a negative impact on the
authorities
environment in the coastal zones"
3.
Establish a common unified system
2001
Implementation of a set of
for environmental port control
measures to reduce and prevent
illegal discharges from ships
4.
Develop a law for the total ban of
2001-
Creation of conditions for
municipal wastes dumping in the
2002
stabilisation of the
coastal zone
environmental situation in the
coastal areas
5.
Develop and introduce criteria for
2001-
Establishment of a system for
maximum allowable anthropogenic
optimal anthropogenic impact
loads to coastal ecosystems
2002
on the environment
6.
Extend existing environmental
Perm- Effective environmental
monitoring in Krasnodar kraj
anent control/ obtaining of
information to assess ecological
status
7.
Extend existing environmental
- " -
- " -
monitorin g in Rostov
8.
Develop a GIS for environmental
2001-
Data base creation to be used
assessment in coastal areas of the
2004 for a comprehensive analysis of
Black Sea and the Sea of Azov
the environmental potential,
ecological sustainability and
economic capacity of a given
area
9.
Improve public education and
Perm- Personnel training to aid
awareness of environmental issues
anent environment protection
(managerial, scientific,
administrative, etc.)
10. Improve co-operation with NGOs
- " -
Arrangement of conferences,
meetings, workshops,
establishment of ecological
committees.
43
6.
TURKISH NUTRIENT ACTION PLAN
6.1 Actions related to legislation
� Issue a Soil Pollution Control Regulation, containing provisions for regulating practices
(production, importation, and marketing) with regard to agricultural inputs. This should:
� Promote the utilisation of manure as fertiliser.
� Set specific objectives and standards for agricultural practices.
� Include enforcement mechanisms.
The Regulation is likely to follow a similar approach to that adopted in the EU Nitrates
Directive (91/676/EEC). Maximum fertiliser application rates (organic and organic) within
designated Nitrate Vulnerable Zones should be adopted in compliance with this proposed
legislation.
� Amend the existing Regulation on Water Pollution Control to include norms and maximum
values for total nitrogen and total phosphorus concentrations in urban wastewater discharges.
� Amend the existing Regulation on Water Pollution Control to include quality criteria for the
classification of groundwater.
6.2 Actions related to monitoring and enforcement
� Develop advice on fertiliser application rates to individual crops based on Olsen-P analysis.
� Convey recommended P, N and K fertiliser application rates to farmers during training.
� Strengthen legal and institutional mechanisms for monitoring fertiliser applications rates to
optimise nutrient usage on both a scientific and economic basis.
� Promote institutional strengthening of local authorities and the Ministr y of Environment to
achieve effective implementation of current industrial discharge regulations.
� Amend the Environment Act to encourage legal action against polluters and introduce
penalties that will genuinely discourage polluters from repeat offences.
� Develop a comprehensive information system to assess compliance rates, the effectiveness of
enforcement procedures, outcomes of court challenges and revenues raised through fines.
6.3 Actions related to pollution control
� Develop and prioritise environmental targets.
� Develop a capital investment pilot scheme to prioritise spending on wastewater treatment.
� Where practicable, install tertiary treatment at major municipal WWTPs.
44
If tackling BOD is the highest priority, then increasing the percentage of WWTPs that use
secondary (biological) treatment is likely to dominate any proposed plan, whereas if
reducing P is the primary aim, then tertiary treatment using iron or calcium salts is likely to
dominate the plan. However, if removal of nitrogen from municipal wastewater is given
equal priority to reducing phosphorus emissions, then tertiary biological treatment
(oxic/anoxic zones) is likely to dominate any proposed recommendations. Wastewater
discharges from Istanbul Metropolitan Area to the lower Bosphorus Strait are approximately
equal to the pollution from the remaining domestic discharges into the Turkish Black Sea.
� Develop a robust agricultural management plan (AMP).
� Integrate the AMP with river basin management plans.
� Promote local government alliances for cost-effective improvements to urban infrastructure
and services, particularly on issues related to solid waste disposal site selection,
development, management and use of new facilities.
� Integrate different treatment technologies, such as incineration, composting and sanitary
landfill within a single solid waste BATNEEC programme
� Increase emphasis on product/waste recycling.
Priority investment projects related to pollution control are presented in Table 6.1, with a
timescale for implementation shown in Table 6.2.
6.4 Other actions
� Provide incentives for small farms to merge and form larger farms.
� Consider taxing agricultural nutrient balance excesses in the longer term.
� Organise basin councils to oversee the development and management of the respective river
basins. These should be led by municipalities and local communities, in co-operation with
NGOs, related government agencies and other stakeholders.
� Prepare river catchment management plans encompassing:
� land use plans
� Reforestation program including participatory schemes.
� Institutional measures including information and education campaigns, training in forest
management techniques, and clarification of land ownership and use rights.
� Establish a water quality/river flow monitoring programme to assess in-stream pollution
loads.
� Construct a national database of wastewater treatment methods employed in industry and
municipal WWTPs.
45
� Prepare municipal land use plans for integration into river catchment management plans.
Table 6.1
List of priority projects
Project
Budget
Priority Level
US$
Construction of Trabzon wastewater treatment plant
31.800.000
1
Construction of Zonguldak wastewater treatment plant 27.000.000
1
Construction of Samsun wastewater treatment plant
16.000.000
1
Construction of Giresun wastewater treatment plant
9.000.000
1
Kizilirmak river basin management plan
3.280.000
1
Sakarya river basin management plan
2.350.000
1
Yesilirmak river basin management plan
2.100.000
1
Development of systems for regional pollution
monitoring and control, establishment of laboratories
1.000.000
1
and in-job training
Preparation of guidelines for manure utilisation as
fertiliser
45.000
1
Development of instruments for Zonguldak coastal
715.000
1
zone management
Public education for environment-friendly agriculture
115.000
1
practices and erosion control
Training farmers in sound fertiliser utilisation and
310.000
2
monitoring of practices
T�GSAI fertiliser plant chemical treatment facilities
9.600.000
2
Construction of Ordu wastewater treatment plant
8.500.000
2
Samsun Industrial Zone wastewater treatment plant
7.500.000
2
Construction of Bafra wastewater treatment plant
6.500.000
2
Trabzon industrial zone wastewater treatment plant
6.100.000
2
Construction of Ereili wastewater treatment plant
4.500.000
2
Bartin industrial zone wastewater treatment plant
2.100.000
2
Development of nutrient recycling and pre-treatment
pollution abatement measures for major industries in
165.000
2
the Black Sea region
Trabzon solid waste disposal project
18.000.000
3
Zonguldak solid waste disposal project
16.000.000
3
Samsun solid waste disposal project
14.000.000
3
Development of regional strategies for the disposal of solid,
4.430.000
3
medical and hazardous waste in Black Sea coastal zone
�aycuma industrial zone wastewater treatment plant
1.700.000
3
46
Table 6.2
Timescale for introduction of the Turkish Nutrient Action Plan
YEARS
Project
Priority Budget US$
Level
1
2
3
4
5
6
7
8
9
10
Construction of Trabzon wastewater treatment plant
1
31.800.000
Construction of Zonguldak wastewater treatment plant
1
27.000.000
Con struction of Samsun wastewater treatment plant
1
16.000.000
Construction of Giresun wastewater treatment plant
1
9.000.000
Kizilirmak river basin management plan
1
3.280.000
Sakarya river basin management plan
1
2.350.000
Yesilirmak river basin management plan
1
2.100.000
Development of system for pollution monitoring and control,
1
1.000.000
establishment of laboratory and in-job training
Development of guidelines for manure utilisation as fertiliser
1
45.000
Development of instruments for Zonguldak coastal zone
1
715.000
management
Public education for env.-friendly agricultural practices &
1
115.000
erosion control
Training for sound fertiliser utilisation and monitor of practice
2
310.000
T�GSAS fertiliser plant chemical treatment facilities
2
9.600.000
Construction of Ordu wastewater treatment plant
2
8.500.000
Samsun industrial zone wastewater treatment plant
2
7.500.000
Construction of Bafra wastewater treatment plant
2
6.500.000
Trabzon industrial zone wastewater treatment plant
2
6.100.000
Construction of Eregli wastewater treatment plant
2
4.500.000
Bartin industrial zon e wastewater treatment plant
2
2.100.000
Development of nutrient recycling and pre-treatment technology
2
165.000
for pollution abatement measures in major industries
Trabzon solid waste disposal project
3
18.000.000
Zonguldak solid waste disposal project
3
16.000.000
Samsun solid waste disposal project
3
14.000.000
Dev. of strategies for the Disposal of solid, medical and
3
4.430.000
hazardous waste
47
�aycuma industrial zone wastewater treatment plant
3
1.700.000
Y
BUDGET ALLOCATION
US$ 192810000 4775000 15715000 2167000030570000 36790000 3344000025550000 14000000 6000000 4700000
48
7.
UKRAINE
7.1 Legal and regulatory measures
The legal and regulatory measures to be adopted by Ukraine as part of its nutrient
action plan are shown in Table 7.1. The include reform and measures to strengthen the
existing legal for environmental protection, in addition to the development of
standardised techniques for pollution assessment that will help in the identification of
major pollution sources in future years.
Table 7.1
Ukrainian legal and regulatory measures
Measures
Type
Lead Institution
Dates
1
On coastal zone of
Law
Ministry of
Sectoral
2001- 2005
the Azov and Black
Environment and
Ministries,
Seas
Natural
Regional and
Resources of
Local Authorities
Ukraine
(MEANR)
2
On lan d use in the
Regulation MEANR
Sectoral
2001- 2005
buffer zone
Ministries,
Regional, and
Local Authorities
3
On designing and
Regulation MEANR
Sectoral
2001- 2005
construction of bank
Ministries,
protection
Regional, and
Local Authorities
4
On assessment of
Technique
MEANR
Sectoral
2001- 2005
pollution load within
Ministries,
rivers
Regional, and
Local Authorities
6
On assessment of
Technique
MEANR
Sectoral
2001- 2005
diffuse pollution load
Ministries,
Regional and
Local Authorities
7
On environmental
Regulation MEANR
Sectoral
2001- 2005
audit
Ministries,
Regional, and
Local Authorities
8
On P -free detergents
Law
MEANR
Sectoral
2001- 2005
Ministries
Regional, and
Local Authorities
10. On nutrients
Regulation
MEANR
Sectoral
2001- 2005
pollution
s
Ministries
Regional, and
Local Authorities
7.2 Environmental monitoring of the Black and Azov seas
In addition to the proposed development of freshwater pollution
monitoring/assessment techniques presented in Section 7.1, it is proposed to develop
and re-start a marine programme to monitor the water and ecological quality of the
Ukrainian sections of the Black and Azov seas (Table 7.3).
49
Table 7.2
Measures on monitoring and assessment of pollution of the Azov
and Black Seas
Measures
Costs,
Dates
Implement ing
USD th.
Institution
Optimisation and improvement of monitoring
144
2001- 2002
MEANR
system for the Black And Azov Seas
Assessment of natural changes and human
3 0
2001- 2002
MEANR
impact on the Azov and Black Sea Basins
Implementation of regional monitoring
2001- 2005
MEANR,
strategy and system
international
donors
7.3 Low cost measures for nutrient reduction in the Black
Sea Basin
The Ukrainian nutrient action plan includes a number of low cost measures, many of
which are local projects identified as either having the potential to reduce nutrient
export substantially or aimed at increasing the self -purification capacity of aquatic
ecosystems (Table 7.2). Other low cost measures are aimed at capacity building to
strengthen the likely success of the current proposed action plan or to promote
additional future nutrient control measures.
Table 7.3
Low cost measures for nutrient reduction in the Black Sea Basin
Location
Measures
Implementing
Dates
institutions
Black Sea Basin
Inventory and assessment of diffuse
MEANR and
2002- 2003
pollution within Black and Azov Seas
Sectoral
Basins
Ministries
Black Sea Basin
Strengthening of Institutional Capacity of
MEANR and
2001- 2004
Local and Regional Control and Regulatory
Sectoral
Bodies
Ministries
Sivesky Donets
Development and Approval of Program on
MEANR and
2001- 2002
Riv er Basin
Protection and Rehabilitation of Siversky
Sectoral
Donets River Basin
Ministries
Southern Bug
Development and Approval of Program on
MEANR and
2001- 2002
River Basin
Protection and Rehabilitation of Southern
Sectoral
Bug River Basin
Ministries
Danube River
Development and Approval of Program on
MEANR and
2001- 2002
Basin
Protection and Rehabilitation of Danube
Sectoral
River Basin
Ministries
Azov and Black
Development and Approval of Regional and
Regional and
2001- 2002
Seas Coastal Zone
Local Action Plans on Protection and
Local
Rehabilitation of Streams of Azov and
Authorities
Black Seas
Black Sea Basin
Development and Organisation of Farmer
Ministry of
2001- 2005
Training and Education Program on Best
Agrarian
Available Technologies and Ecologically
policy
Sound Land and Animal Husbandry.
Black Sea Basin
Organic Farming Pilot Projects
Ministry of
2001=2005
Agrarian
Policy,
MEANR
Black Sea Basin
Inventory and Assessment of P - load from
MEANR
2001- 2003
detergents
50
Table 7.3... continued
Location
Measures
Implementing
Dates
institutions
Crimea
Development of projects of regional
Local and
2000- 2001
landscape parks "Kalynivsky" and National
regional
Park "Syvashsku"
authorities
Inventory of Pollution Sources of Eastern
2000- 2003
and Western Basins of the Lake Sasyk
Introduction of integrated coastal zone
2001
management
Inventory of landfills within the Azov and
2001
Black Seas buffer zone and development of
measures for their relocation
Control of water quality from collectors and
2001- 2005
drainage systems from rice checks
Donetsk Region
Implementation of the pilot project on
Local and
2001
regulation and control of toxic waste
regional
management in Mariupol
authorities
Development of Regional Program on
2001
Prevention of Erosion of the Azov Sea
Coast
Inventory of Household Dumping Sites
2001- 2003
within the Black and Azov Seas Buffer
Zone and Development the System of Their
Relocation
Zaporizhia Region
The Forest Management by the Enterprises
Local and
2001
of Agro -Industrial Sector of the Azov Sea
regional
Basin < total 39837 ha
authorities
Passportisation of streams and development
2000- 2002
of river basin systems for protection and
rational use of water and land resources
Creation of GIS System for Azov Sea
2001
Within the Zaporizhia Region
Development of Program of Erosion
2001- 2005
Preventive Measures in Zaporizhia Region
Establishing the boundaries of coastal zone
2001- 2005
of the Azov Sae
Mykolaiv Region
Development of projects of buffer zones for
Local and
2001- 2002
limans of Mykolaiv Region
regional
authorities
Environmental Impact Assessment of Dam
2000- 2001
in Berezan Bay
Odesa Region
Implementation of integrated coastal zone
Local and
2001
management
regional
authorities
Development of local environmental action
2001
plans for protection of the Black Sea
Inventory of Household Dumping Sites
2001- 2003
within the Black Sea Buffer Zone and
Development the System of Their
Relocation
Kherson Region
Development of recommendations on
2001
protection and rational use of wetlands
Creation of Lower Dnipro Landscape Park
2001- 2005
Sevastopol
Sanitary cleaning of streams
Local and
2001
regional
authorities
Environmental mapping of polluted
2001- 2003
territories
Inventory of Household Dumping Sites
2001- 2003
within the Black and Azov Seas Buffer
Zone and Development the System of Their
Relocation
Implementation of Integrated Coastal Zone
2001- 2010
Management
51
7.4 Major Ukrainian projects for nutrient reduction
Major investment projects are shown in Tables 7.4 and 7.5. These are concerned
primarily with upgrading and construction of new WWTPs, but projects on coastal
protection, solid waste disposal, wetland management/restoration and control of
diffuse pollution are also proposed.
Table 7.4
Major investment projects for nutrient reduction in Ukraine, 2001 -
2005, mln. USD
Measures
Total 2001- 2005
Incremental
Legal Base
costs
Wastewater treatment and sewer
119.5
34.0
85.5
State Program on
system, total in the Black Sea
Water Supply and
Coastal Zone, Total
Canalisation
Crimea
12.2
3 . 2
9.0
Donetsk
12.1
6 . 4
5.7
Zaporizhia
5.2
4 . 6
0.6
Mykolaiv
41.5
3 . 4
38.1
Odesa
16.1
5 . 2
10.9
Kherson
12.3
4 . 3
8.0
Sevastopol
20
6 . 4
14.7
Solid Waste Management, Total
22.8
5 . 1
17.7
State Program on
Protection and
Rehabilitation of
the Azov and
Black Seas
Crimea
Donetsk
13.6
1 . 8
11.8
Zaporizhia
2.4
1 . 5
0.9
Mykolaiv
Odesa
0.6
0 . 6
0
Kherson
0.1
0 . 1
0
Sevastop o l
6.1
1 . 2
3.9
52
Table 7.5
List of priority projects to be funded under GEF pollution reduction programme
Location
Category
Description
Current
Required
Nutrient
Co -
Implementing
National
Duration
Cost
Cost �
situatio
activities
reduction
ordinating
Agencies
Regional
(years)
Estimat
sharing
n
Benefits
Agency
Priority
e
potential
ml.
USD
1
Kherson
WWTP
WWTP
Hot
expansion and
reduction of
MEANR
Kherson State
high
1 0
3 . 3
potential
facilities and
sport
upgrading
discharges from
Regional
investme
sewer system
wastewater
municipal
Administratio
nt
are
treatment
wastewater
n
project
overloaded
facilities and
treatment plants
and poorly
sewer syst e m s
maintained
2
Mykolaiv WWTP
WWTP
Hot spot exp ansion and
reduction of
MEANR
Mykolaiv
high
1 0
41.5
potential
facilities and
upgrading
discharges from
State Regional
investme
sewer system
wastewater
municipal
Administratio
nt
are
treatment
wastewater
n
project
overloaded
facilities and
treatment plants
and poorly
sewer systems
maintained
3
Kerch
WWTP
WWTP
hot spot
expansion and
reduction of
MEANR
Kerch state
high
1 0
2 . 8
low
facilities and
upgrading
discharges from
administration
sewer system
wastewater
municipal
; Crimea
are
treatment
wastewater
Government
overloaded
facilities and
treatment plants
and poorly
sewer systems
maintained
4
Skadovsk WWTP
WWTP
hot spot
expansion and
reduction of
MEAN R
Kherson
high
5
1 . 3
low
facilities and
upgrading
discharges from
regional state
sewer system
wastewater
municipal
administration
are
treatment
wastewater
overloaded
facilities and
treatment plants
and poorly
sewer systems
maintained
53
5
Odesa
WWRP and
WWTP
hot spot
expansion and
reduction of
MEANR
Odesa
high
5
16.1
sewer
facilities and
upgrading
discharges from
regional state
system
sewer system
wastewater
municipal
administration
are
treatment
wastewater
overloaded
facilities and
treatment plants
and poorly
sewer systems
maintained
Table 7.5... continued
Location
Category
Description
Current
Required
Nutrient
Co -
Implement ing
National
Duration
Cost
Cost �
situatio
activities
reduction
ordinating
Agencies
Regional
(years)
Estimat
sharing
n
Benefits
Agency
Priority
e
potential
ml.
USD
6
Sevastop
WWTP and
WWTP
Hot spot expansion and
reduction of
MEANR
Sevastopol
high
5
16.7
o l
sewer
facilities and
upgrading
discharges from
city state
system
sewer system
wastewater
municipal
administration
are
t reatment
wastewater
overloaded
facilities and
treatment plants
and poorly
sewer systems
maintained
7
Berdians
WWTP
WWTP
hot spot
expansion and
reduction of
MEANR
Zaporizhia
high
2 4
9 . 3
low
k
facilities and
upgrading
discharges from
regional state
sewer system
wastewater
municipal
administration
are
treatment
wastewater
overloaded
facilities and
treatment plants
and poorly
sewer systems
maintained
8
Coastal
River
small rivers
NGO
ecological
establishment
MEANR
State Regional high
2 4
1 . 0
medium
zone of
p ollution
are polluted,
activitie
rehabilitation of
of buffer zones;
Administratio
the Black reduction
buffer zones
s, no
small rivers
clean up
ns and local
and Azov
are not
sufficie
campaign
authorities of
Seas
established,
nt
public
coastal zone;
population is
support
awareness
NGOs
not
campaign
environmental
ly concerned
54
9
Syvash
wetlands
inappropriate
WWF,
reduct ion of
introduction of
MEANR
coastal
high
3 6
1 . 0
high
management agricultural
GEF
diffuse
sustainable
regional state
practices, lack W B
agricultural
agricultural
administration
of buffer
pollution,
practices
s
zones,
biodiversity
biodiversity
conservation
degradation
55
Table 7.5... continued
Location
Category
Description
Current
Required
Nutrient
Co -
Implementing
National
Duration
Cost
Cost �
situatio
activities
reduction
ordinating
Agencies
Regional
(years)
Estimat
sharing
n
Benefits
Agency
Priority
e
potential
ml.
USD
10
Dnister
wetlands
wetland
docume
conservation of
park
MEANR
Odesa state
high
2 4
1 . 0
high
mouth,
restoration
degradation,
ntation
biodiversity,
development;
regional
Dnister
ina ppropriate
is
restoration of
restoration of
administration
liman
agricultural
prepare
wetland and
wetlands;
,
practices in
d for
establishment of
public;
local
coastal zone
govern
Low Dnister
i n stitutional
authorities;
mental
National Park
strengthening
EUCC
approva
awareness
l
campaigns;
11
Kerch,
aqua culture Based in
TACIS
production
will decrease
MEANR
State
high
2 4
2 . 0
will be
Odesa,
Kerch, Odesa
project
facilities;
eutrophication
Committee on
ready for
Sevastop
and
in Kerch marketing
of coastal
Fisheries
investme
o l
Sevastopol
studies;
waters, will
n t s
development of
improve the
Odesa Branch
regulations
economic
of IBSS
aquaculture
conditions of
farming
the population
Kerch
of coastal zone
Instit ute of
Fisheries and
Oceanography
12
Pryasovje conservatio
establishing
Donetsk
building
biodiversity
MEANR
Donetsk state
high
2 4
1 . 0
high
n; pollution
the National
regional
institutional
conservation
regional
reduction
park
state
capacity,
and reduction of
administration
Lukomorje
administ
establishing
diffuse
ration
buffer zones,
agricultural
introduction of
pollution
ecologically
sustainable
businesses
56
57
Table 7.5... continued
Location
Category
Description
Current
Required
Nutrient
Co -
Implementing
National
Duration
Cost
Cost �
situatio
activities
reduction
ordinating
Agencies
Regional
(years)
Estimat
sharing
n
Benefits
Agency
Priority
e
potential
ml.
USD
13
Lower
wetlands
institutional
GEF,
building
reduction of
MEANR
Kherson
high
2 4
1 . 0
high
Dniper
management develo pment,
IDRC
institutional
agricultural
regional State
establishment
Canada,
capacity,
pollution from
administration
of national
US AID
establishing
rice checks
parks
buffer zones,
introduction of
ecologically
sustainable
businesses
14
Southern
water
management
TACIS
building the
will promote
MEANR
Industrial,
High
1 2
0 . 5
high
Bug
management of river basin
educatio
institutional
and support
Agricultural,
River
is not
nal
capacity
nutrient
municipal
Basin
introduced,
project
Devel opment of
reduction
sectors
pollution from
the Southern
activities and
municipal,
Bug water
measures
industrial and
management
agricultural
plan;
sources
establishing
buffer zones,
etc.
15
Sasyk
water and
diffuse
WWF
feasibility study
will asses the
MEANR
Odesa
high
2 4
0 . 5
high
lake
land
pollution
scope of
regional
management sources of
problems and
administration
surface and
show ways how
s, National
ground
to deal with
Academy of
waters;
Sasyk lake
Sciences,
impact on
local
human health
authorities
58
16
Coastal
solid waste
diffuse
TACIS
relocation of
will decrease
MEANR
regional
high
3 6
0 . 5
high
zone of
management pollution
project
dumping sites
surface
administration
the Black
sources of
from the marine
nutrients run -
s; economic
and Azov
surface and
buffer zone of
off and hygienic
sectors
Seas
ground waters
the Black and
state of coastal
Azov Seas
waters
59
Table 7.5... continued
Location
Category
Description
Current
Required
Nutrient
Co -
Implementing
National
Duration
Cost
Cost �
situatio
activities
reduction
ordinating
Agencies
Regional
(years)
Estimat
sharing
n
Benefi t s
Agency
Priority
e
potential
ml.
USD
17
legislatio
developmen
lack of proper
W B
development of
will create legal MEANR
regional
high
3 6
0 . 2
high
n and
t of
coastal
Law on Coastal
environment to
administration
institutio
legislation
legislation
zone and Code
deal with
and sectors
nal
on coastal
and
of Conduct;
diffuse and pint
developm
zone
institutional
institutional
pollution
ent
management capacity
capacity
sources
building
60
61
8.
DISCUSSION
In considering the national action plans, it must be appreciated that the majority of
Black Sea countries are currently undergoing a major economic depression, so that
industrial productivity levels are now a fraction of what they were in 1989 before the
collapse of the Soviet Block. Likewise, livestock levels are now about half the
number and inorganic fertiliser application rates are very low compared to levels at
that time. A major aim of the Regional plan should therefore be to address
infrastructural needs so that when economic recovery does occur, appropriate systems
are in place to control/manage nutrient import into the Region and export to the Black
Sea. Otherwise, nutrient loads to the Black Sea are likely to become greater than at
any other time in history.
Enforcement is not given a high priority in many of the action plans, but this is
essential to the success of any nutrient control programme aimed at industrial or
municipal discharges. Instead, the emphasis appears to be on capital investment
projects, with no information presented on how maintenance of such structures will be
funded. If no maintenance programmes or funds to support them are provided, then
capital investment projects should be viewed with extreme caution. Enforcement
should be at the heart of any planned infrastructural, capacity building, legal or capital
investment reforms. Moreover, enforcement requires robust monitoring, analytical
and administrative back-up services. Again, several of the national action plans would
benefit from further attention to this.
A stronger focus on the development of N and P criteria for industrial (fertiliser and
detergent production and food processing) and municipal WWTP discharge consents
would further improve the robustness of the Regional action plan.
Harmonisation with EU legislation has been a major driver towards the development
of national nutrient action plans for some countries, particularly with regard to the
UWWT and Nitrates Directives. Although not mentioned in this report, however, the
EU Habitats Directive could be used as a major driver for reducing nutrient emissions
to the Black Sea, particularly if Black Sea marginal/coastal areas are designated as
Special Areas of Conservation (SACs). If such designations did occur, then the
discharge consents of all point sources upstream of the SACs would need to be
reviewed and, where necessary revised, particularly with regard to nutrient criteria.
Likewise, diffuse agricultural pollution from upstream areas and atmospheric
deposition of nitrogen would also be subject to review and greater control measures.
This whole-catchment approach is endorsed in the proposed EU Water Framework
Directive.
The selection of indicators will be key to judging the success of sectorial, national and
regional nutrient action programmes. It is clear that livestock inventories, national
inorganic fertiliser sales records and regulation/enforcement indicators (e.g. number
of full-time regulation/enforcement officers employed by the state, annual number of
samples analysed for nitrogen and phosphorus) could all be very important. However,
the choice of indicators must also be pragmatic; for example, the dominance of the
black market economy is likely to make the collection of reliable fertiliser sales data
effectively impossible. This underlies the approach for agricultural reform
programmes. Education is central to the development of sustainable agricultural
62
practices, but providing a legislative, rather than an advisory basis, for such
programmes may have little effect, since enforcement is effectively impossible. This
is particularly so due to the collapse of large state-run farms and the development of
many more (but much smaller) private farms.
At present, the depressed economies probably mean that enforcement of agricultural
norms is not a major issue. Most farmers cannot afford the levels of inorganic
fertiliser required for cost-effective crop production, and the market for livestock
products (milk, meat, etc) is now so much smaller than before the economic collapse
of the late 1980s and 1990s. However, as intimated in the opening paragraph of this
discussion, a major aim of the regional action plan should be to put structures in place
so that when enforcement is required in the future, it can be successfully
implemented.
Some of the national action plans include the completion of a livestock inventory, yet
for government control of agricultural policy, this should be a pre-requisite.
(Although the collection of such information is clearly a major undertaking requiring
full co-operation from all farmers, regardless of farm size.) Thus, the development of
robust national agricultural census surveys, together with the infrastructural support
required to collect this information, should be a very useful indicator of both
economic status and nutrient action plan success status.
Although mentioned as an action in several of the national nutrient plans, the
development of an environmental monitoring programme for the Black and Azov
Seas should be viewed as an essential component of all the national plans. The
selection of appropriate indicators should yield much information about the success of
the regional and national action plans. However, monitoring the nutrient and
ecological status of the seas is the only way of providing incontrovertible evidence of
whether or not the action plans are succeeding in improving the quality of the seas
themselves.
Finally, atmospheric deposition of nutrients has not been addressed at all in any of the
national action plans. This is not of great importance for phosphorus, but it is quite
possible that some 20-40% of the nitrogen load to the Black Sea enters via
atmospheric deposition. Nitrogen emissions to the atmosphere occur from municipal
WWTPs, the agricultural sector and those sectors involving the combustion of fossil
fuels (power generation, many industrial processes and the transport sector, etc.). For
those countries undergoing harmonisation with EU legislation, the IPC/IPPC
Directiv es will cover the problem of atmospheric emission/deposition to some extent,
but this issue will need to be addressed by the other countries.
63
REFERENCES
Parr, B. and Reynolds, P.J. (2000) The development of process, stress reduction and
environmental status indicators to monitor the effects of nutrients within the Black
Sea Basin. Draft Discussion Report presented to the Black Sea Environment
Programme.
Parr, W., Varduca, A., Stoimenova, M., Tarasova, O., Shekhovstov, A., Stepanova,
L., Kerestecioglu, M. and Lomtadze, Z. (2000) A review of nutrient-related
legislation, policies and practices in black sea riparian countries. Report presented to
the Black Sea Environment Programme.
64
Annex 10
THE DEVELOPMENT OF PROCESS, STRESS
REDUCTION AND ENVIRONMENTAL
STATUS INDICATORS TO MONITOR THE
EFFECTS OF NUTRIENTS WITHIN THE
BLACK SEA BASIN
DRAFT DISCUSSION PAPER
PREPARED BY B. PARR1 AND P.J.REYNOLDS2
1 Principal Biologist, Water Quality Science, Thames Region
Environment Agency, Kings Meadow House, Kings Meadow Road,
Reading, RG1 8DQ, UK. Tel: +44 (0)118 9535161.
E-mail bill.parr@environment-agency.gov.uk
2 Technical Advisor, Black Sea Programme Implementation Unit
Dolmabahce Sarayi II. Hareket Kosku, 80680 Besiktas, Istanbul,
Turkey Tel: +90 212 2279927, Fax: +90 212 2279933. E-mail:
reynoldsp@dominet.in.com.tr
65
EXECUTIVE SUMMARY.........................................................................................68
OBJECTIVES OF THE DISCUSSION PAPER.........................................................70
1 PROCESS AND STRESS REDUCTION INDICATORS ...................................71
1.1 Background ......................................................................................................71
1.1.1
The framework mechanism........................................................................................................ 71
1.1.2
A strategy to achieve common pollution reduction goals .......................................................2
1.1.3
GEFs nutrient reduction programme ..........................................................................................3
1.1.4
Key stakeholders .......................................................................................................................... 75
1.2 Process and Stress Reduction Indicators to Monitor the Performance of
National Nutrient Reduction Action Plans within the Black Sea Region ........76
1.2.1
General Objectives....................................................................................................................... 76
1.2.2
Potential indicators for the agricultural sector ........................................................................ 77
1.2.3
Potential indicators for the industrial sector............................................................................ 79
1.2.3
Potential indicators for the municipal sector........................................................................... 80
2. ENVIRONMENTAL STATUS INDICATORS...................................................86
2.1 Preamble ...........................................................................................................86
2.2 Definitions ........................................................................................................86
2.3 Nutrients and Coastal Waters - an overview ....................................................87
2.3.1
Limiting nutrients ......................................................................................................................... 87
2.3.2
Nutrient sources ............................................................................................................................ 88
2.3.3
Nutrient cycling............................................................................................................................ 88
2.3.4
Organic carbon ............................................................................................................................. 90
2.4 Lessons learnt from previous trophic status monitoring programmes .............91
2.4.1
Physical and Biological Factors.................................................................................................91
2.4.2
Alternative Stable States ............................................................................................................. 92
2.4.3
Chemical Factors - Internal Loading ........................................................................................ 93
2.4.4
Seasonality .................................................................................................................................... 93
2.4.5
Nutrient bioavailability ............................................................................................................... 95
2.5 Potential Indicators...........................................................................................96
2.5.1
Chemical Loads to the Black Sea .............................................................................................. 98
2.5.2
Chemical Concentrations and Nutrient Cycling Within the Black Sea .............................. 98
2.5.3
Physical Indicators � turbidity-related parameters.................................................................98
2.5.4
Biological Indicators � Microalgae.........................................................................................100
2.5.5
Biological Indicators � Macroalgae and Higher Plants .......................................................103
2.5.6
Invertebrates................................................................................................................................106
2.5.7
Other Indicators ..........................................................................................................................108
2.6 Summary of Recommended Trophic Status Monitoring Programme............ 110
References for Sections 1 and 2................................................................................. 115
APPENDIX A DATA ANALYSIS......................................................................... 124
A.1 River Concentration and Flow Data ............................................................... 124
APPENDIX B Proposed monitoring strategy for the Black Sea............................. 127
APPENDIX C A REVIEW OF ECONOMIC INSTRUMENTS USED FOR
NUTRIENT CONTROL.................................................................... 131
Preamble ................................................................................................................. 131
C.1 Key Aspects of Economic Instruments .......................................................... 131
C.1.1
Key issues of nutrient control ..................................................................................................131
C.2 Range and type of instruments used for nutrient control ............................... 132
C.2.1
Sweden.........................................................................................................................................133
C.2.2
Switzerland..................................................................................................................................134
C.2.3
United States...............................................................................................................................135
C.2.4
Netherlands ..................................................................................................................................138
C.2.5
Belgium........................................................................................................................................139
C.2.6
Denmark ......................................................................................................................................140
C.2.7
Germany ......................................................................................................................................141
C.2.8
France ...........................................................................................................................................142
C.2.9
Other countries ...........................................................................................................................143
C.2.10 Experience with Applied Economic Instruments � Summary ............................................143
66
C.2.11 Experience with other sources .................................................................................................148
C.3 Empirical research into economic instruments for N and P ........................... 148
C.3.1
Targeting instruments to reflect local variability..................................................................148
C.3.2
Impacts of various control options on affected sectors........................................................151
C.3.3
Integration with other policies .................................................................................................152
C.3.4
Barriers to implementation .......................................................................................................153
C.4 Cost structures................................................................................................ 154
C.4.1
Elasticities of demand for fertiliser.........................................................................................154
C.4.2
Abatement costs .........................................................................................................................154
C.4.3
Damage costs/benefits...............................................................................................................156
C.5 Economic Instruments for N utrient Control within the Black Sea Region.... 157
C.5.1
Bulgaria........................................................................................................................................157
C.5.2
Georgia.........................................................................................................................................158
C.5.3
Romania .......................................................................................................................................158
C.5.4
Russia...........................................................................................................................................159
C.5.5
Turkey ..........................................................................................................................................160
C.5.6
Ukraine.........................................................................................................................................160
References for Appendix C........................................................................................ 160
67
EXECUTIVE SUMMARY
The main objective of the GEF Nutrient Reduction Programme for the Black Sea is to
assist in the implementation of the practical measures for restoring and protecting the
Black Sea environment agreed by the coastal countries in the 1996 Strategic Action
Plan (SAP) for the rehabilitation and Protection of the Black Sea. The key issues to be
addressed under the GEF are in direct support of the recommendations of the Joint ad-
hoc Working Group of the ICPBS and the ICPDR. As a component of the GEFs
basin-wide Programmatic Approach to the Black Sea, the proposed nutrient reduction
programme is aimed at helping the Black Sea countries to develop and implement
action plans to prevent and remedy nutrient releases, through a combination of: (i)
development, reform and enforcement of environmental policy and legislation; (ii) the
application of economic instruments (iii) strengthening public participation in
nutrients reduction; and (iv) monitoring of trends and compliance for nutrient
reduction goals.
The present UNDP/GEF Project Development facility carried out by the PIU in
Istanbul includes (i) the provision of technical support to national and regional bodies
for the formulation and implementation of policy and legislation with respect to
nutrient discharge and control in the Black Sea region, i.e. the development of draft
framework nutrient reduction plans (national and regional) for implementation over
the next five years, and (ii) technical support to develop process, stress reduction and
environmental status indicators to determine the effectiveness of the strategies
employed for nutrient reduction. This report focuses on the development of
appropriate indicators to monitor the efficacy of the national nutrient reduction plans.
In the short term, the actions which are required not to exceed nutrient (and hazardous
substances) levels above those encountered in 1997 fall upon the agricultural,
industrial and municipal sectors. Process indicators identified in each sector are
primarily developmental in function. In the agricultural sector, indicators include the
development of (i) institutional framework for integrated environmental management,
(ii) national action plans to prevent minimisation of erosion, (iii) national plans to
enhance organic farming practice and assess diffuse pollution, and (iv) the
development of an appropriate model for data assessment. Within the industrial and
municipal sectors, the process indicators provide a measure for the development of
the financial, institutional and legal frameworks required for upgrading/construction
of facilities as well as for regulatory purposes.
Indicators are highlighted in each sector, which upon initiation or completion will
represent a direct reduction on the stress caused by nutrients (or hazardous
substances) to the black Sea ecosystem. Notably, for the agricultural sector, such
reduction of stress resides with the provision of mechanism/incentives to control
inorganic fertiliser application and establish guidelines for the disposal or re-use of
manure. Within the industrial and municipal sectors, stress reduction indicators are
identified as the initiation of upgrading or construction of facilities to control the
collection and treatment of solid and liquid wastes.
The reduction of the phosphate content of industrial and domestic detergent
formulations is suggested in two stages: initially a process indicator is identified as
the liaison between national representatives and the detergent industry to review
national detergent usage and prioritise products/formulations for review. Stress
68
reduction is subsequently identified as the agreement of a 5-year Environmental Code
of Practice between the national regulatory authorities and the detergent industry
aimed at a change to specified P-free detergents in the market by year 2005.
With respect to environmental status, the potential indicators that are available to
monitor the extent of eutrophication in the Black Sea over time are reviewed, and a
summary of the indicators that are judged to provide the most relevant information for
the region is presented. Indicators include chemical loads, nutrient concentrations,
physical indicators, microalgae, macroalgae and higher plants and sediment infauna.
To monitor progress of the 5-year nutrient reduction plans will require only the
chemical load monitoring data, since the action plans are written wit h the specific aim
of reducing nutrient loading to the Black Sea; the reduction in trophic status is an
expected benefit of this. Moreover, while 1997 has been chosen as the baseline date
for chemical concentration/nutrient load monitoring, it will not be possible to use this
date as the baseline for other indicators, since appropriate monitoring data were not
collected at that time. However, to know whether the nutrient action plans have had
the desired effect of lowering the trophic status of the Black Sea, it will be necessary
to monitor all of the recommended indicators.
A review of current economic instruments used for nutrient control (primarily in the
agricultural sector) has been included within the report solely to aid those responsible
for the as sessment and the future implementation of economic instruments in the
Black Sea region. The review details, on a worldwide basis, the following experience
of economic instruments used for nutrient control: (i) the range and type of
instruments, (ii) past research into economic instruments for N and P and (iii) cost
structures. Economic instruments presently in use for nutrient control within the Black
Sea region are also provided. No attempt has been made by the authors to suggest
appropriate instruments for use within the Black Sea region as this is outside the
scope of the present study.
69
OBJECTIVES OF THE DISCUSSION PAPER
The focus of this paper is to discuss the rationale for the development of indicators,
based on GEFs process, stress reduction and environmental status framework, which
will be used to monitor the effects within the Black Sea marine ecosystem prior to and
following the implementation of national nutrient reduction action plans.
The paper is organised in the following way: Sectio n 1 provides a review of the
framework mechanism supporting the GEF nutrient reduction programme and also
outlines the process and stress reduction indicators which are required to monitor the
performance of national nutrient reduction action plans. Section 2 reviews the
potential environmental status indicators and provides a list of recommended
indicators for use in the Black Sea region. Information pertinent to river concentration
and flow data is highlighted in Appendix A. The current proposed monitoring strategy
for pollution assessment in the Black Sea is outlined in Appendix B. Finally, a review
of economic indicators, which have been employed throughout the world for nutrient
control, is provided in Appendix C as an aid to future development in the region.
70
1
PROCESS AND STRESS REDUCTION INDICATORS
1.1 Background
1.1.1 The framework mechanism
The guidelines for the protection of the Black Sea against pollution are detailed in the
Bucharest Convention, which was signed on April 21st 1992 by representatives of
Bulgaria, Georgia, Romania, the Russian Federation, Turkey and Ukraine. The
Convention was ratified 1998 but not fully implemented owing to the failure of
coastal countries to reach agreement on financial arrangements for its Secretariat.
Presently, the implementation of the Convention is carried out the Istanbul
Commission for the Protection of the Black Sea (ICPBS).
The Bucharest Convention stipulates (Article VI) that each Contracting Party shall
prevent pollution to the marine environment of the Black Sea from any source of
hazardous or noxious substances and matter, as specified in the Annex to the
Convention. Protection of the marine environment against nutrients is listed in Annex
II of the Convention under the statement: `Substances which, although of a non -toxic
nature, may be harmful to the marine biota owing to the quantities in which they are
discharged e.g. inorganic phosphorus, nitrogen, organic matter and other nutrient
compounds. Also substances which have an adverse effect on the oxygen content of
the marine environment'.
The Bucharest Convention also includes a Protocol for the protection of the Black Sea
marine environment against pollution from land-based sources. This annex is
accompanied by two Annexes, which separately detail the regulation of hazardous and
noxious substances and matter, including nitrogen and phosphorus. This annex does
not apply to discharges that contain nitrogen and phosphorous which are below the
standards defined jointly by the Contracting parties, not exceeding environmental
background concentrations.
In April 1993, the Contracting parties reaffirmed their commitment to the Bucharest
Convention by the signing of the Odessa Declaration, which was a pragmatic 3-year
policy agreement largely implemented with financial and technical support from the
GEF and CEC. The policies within the Declaration were carried out under the
direction of the Black Sea Programme Coordination Unit in Istanbul.
The first insight into the regional extent of the problem of eutrophication within the
Black Sea was provided by a Transboundary Diagnostic Analysis (TDA), carried out
between 1992 and 1996, which identified the main sources and provided empirical
quantitative analysis of pollutant loads from each of the Black Sea countries and from
international rivers. Given that the Danube was shown to be the largest single source
of nutrient input to the Black Sea, it was deemed imperative that strategies for the
reduction of nutrients be adopted for this river.
The Strategic Action Plan (SAP) for the Rehabilitation and Protection of the Black
Sea was signed in October 1996, with adoption at Ministerial level in 1998. This
document provided the riparian countries with a wide ranging plan, which includes
the setting of goals and milestones, covering many aspects of environmental
protection in the Black Sea, including nutrients. The SAP is currently managed by a
71
Project Implementation Unit in Istanbul, Turkey, pending the formation of the
Istanbul Commission Secretariat
To address the problem of eutrophication in the Black Sea on a basin-wide level, the
SAP was designed to pay particular attention to nutrients and defines the objective of
a Black Sea Basin Wide Strategy to negotiate a progressive series of stepwise
reductions in nutrient loads, until agreed Black Sea water quality objectives are met.
To effectively tackle the problem of eutrophication, the SAP also highlighted the need
for the formation of a cooperative mechanism within the entire Black Sea drainage
basin.
In relation to the Danube, The Strategic Action Plan for the Danube River Basin,
which was adopted at Ministerial level in 1994, was initially managed by the
Environmental Programme for the Danube River Basin (EPDRB) in Vienna.
Following the ratification of the Danube River Basin Convention (DRBC � known as
the Sophia Convention) in 1988, the EPDBR handed over responsibility for the SAP
to the ICPDR, the a decision making body charged with the implementation of the
DRBC.
1.1.2 A strategy to achieve common pollution reduction goals
In early 1998, a Joint ad-hoc Technical Working Group was established between the
Bucharest and Sofia Conventions, consisting of representatives from all of the Danube
and Black Sea States. The Terms of Reference for the Working Group detailed the
primary activities, which included the assessment of available water quality data and
nutrient loadings from the Black Sea Basin, as well as the determination of strategies
and approaches for implementation of pollutant reductions. The latter task comprised
of (i) defining common pollutant reduction goals, (ii) assessing whether or not the
implementation plans of the SAPs undertaken in the Black Sea Basin were sufficient
to achieve the common pollutant reduction goals, and (iii) the proposal, if required, of
recommendations for improvements and amendments to the implementation plans of
the SAPs to facilitate achievements of the common pollution reduction goals. In
regard to strategies, the Working Group were supported by developments of National
Action Plans (NAPs) for each of the Black Sea countries and National Reviews for
the Danube countries.
During the first meeting of the Working Group, it was recognised that no precise
ecological indicators were available which could demonstrate the change over time of
ecosystems in the Black Sea. Accordingly, and within the lifetime of the Working
Group, the Danube GEF programme funded national studies within the Black Sea
States to elaborate on such ecological indicators of eutrophication.
To facilitate completion of the tasks by the Working Group in time for the proposed
joint Black Sea-River Danube meeting at the level of Heads of Delegations, the
timeframe of the Working Group was restricted to nine months, with meetings
scheduled every three months. The findings of the Working group were to fulfil two
roles; (i) to provide background material and guidance for the Black Sea-River
Danube meeting, and (ii) to support technical inputs for the preparation of new GEF
projects within the region for submission to the November 1998 meeting of the GEF
council.
Co-operation between the Istanbul Commission for the Bucharest Convention (Black
Sea) and the ICPDR in the Danube led to the recommendation (ICPBS/ICPDR, 1999)
72
that in the long term, all States in the Black Sea Basin should "take measures to
reduce the loads of nutrients and hazardous substances to such levels necessary to
permit Black Sea ecosystems to recover to conditions similar to those observed in the
1960s". It was agreed however that "as an intermediate goal, urgent control measures
should be taken by all states in the Black Sea Basin in order to avoid that the
discharges of nutrients (and hazardous substances) into the Sea exceed those which
existed in 1997". In the short term, the actions require d to attain this were identified
by the Working group as falling into the following area: (i) reforms of agricultural
policies, (ii) improvement of wastewater treatment (including the use of alternative
low cost technologies), (iii) rehabilitation of essential aquatic ecosystems, (iv)
changes in consumer practice (targeted specifically at the use of phosphate-free
detergents).
The Working group also recommended that a review of progress be undertaken in
2007 to focus on further measures that may be required for meeting the long term
objective of reaching an ecological status similar to that observed during the 1960s
(Joint Ad-hoc Technical Working Group ICPDR � ICPBS summary report, June
1999).
1.1.3 GEFs nutrient reduction programme
The main objective of the GEF Nutrient Reduction Programme for the Black Sea is to
assist in the implementation of the practical measures for restoring and protecting the
Black Sea environment agreed by the coastal countries in the 1996 Strategic Action
Plan (SAP) for the rehabilitation and Protection of the Black Sea. The key issues to be
addressed under the GEF are in direct support of the recommendations of the Joint ad-
hoc Working Group of the ICPBS and the ICPDR.
As a component of the GEFs basin-wide Programmatic Approa ch to the Black Sea,
the proposed programme is aimed at helping the Black Sea countries to develop and
implement action plans to prevent and remedy nutrient releases, through a
combination of:
� Development, reform and enforcement of environmental policy and
legislation;
� The application of economic instruments;
� Strengthening public participation in nutrients reduction;
� Monitoring of trends and compliance for nutrient reduction goals
Assisting the countries to implement these necessary measures is the main objective
of the proposed GEF Black Sea Basin Programmatic Approach, which consists of the
following two basic components;
1. A "Strategic Partnership" to prepare country level investment projects
for nutrient reduction under the leadership of the World Bank.
2. GEF Regional Projects (Danube and Black Sea) to support regional
coordination, capacity building and policy, legal and institutional
reforms for nutrient reduction. These will be jointly implemented by
the three GEF implementing agencies under the leadership of UNDP
Through the World Bank/GEF Strategic Partnership, projects will be identified which
will make a significant contribution to the control and/or abatement of nutrient
73
discharges to the Black Sea. It is assumed that all national, priority environmental
investment projects are identified in NBS-SAP and NEAPs
The foremost criteria in project selection for GEF funding, which is obligatory, is that
only incremental costs will be covered. An environmental project, whatever its form
will have two components; a baseline cost, which relates to improvements needed to
address national impacts, and an incremental cost, which relates to improvements to
address regional impacts. However, in many cases, the incremental component is so
small as to be negligible . The proportion of incremental to baseline cost of any one
project will depend upon the category to which incremental benefits being evaluated
The level of incremental cost has to be calculated on a project by project basis
because of these variables, involving complex economic analyses. The level of work
required to calculate `exact' incremental costs for every project will too involved and
time consuming for an initial project selection stage and therefore a simplified
methodology based possibly on gener ic project types is proposed to be developed as a
guide to help in project selection.
The two regional projects are proposed to strengthen the respective Secretariats on all
aspects of nutrient reduction issues. A PDF- Block B grant has been allocated in early
2000 for the purpose to preparing the Black Sea Regional Project. The regional
benefit of the PDF grant is to establish the regional and the national structures needed
for the management and ultimate full implementation of the Nutrient Reduction
Programme in the Black Sea. A regional structure is required in order to coordinate
the country activities in general, ensure consistent and prioritised National Action
Plans (NAPs), ensure liaison among the GEF partners (WB, UNDP and UNEP), and
the national governments, competent national bodies, national and regional
institutions and NGOs.
The PDF provides financial assistance with respect to the strategy for nutrient
reduction, by providing (a) provision for the formation of national inter -ministerial
committees responsible for issues of nutrient use and control, (b) technical support to
national and regional bodies for the formulation and implementation of policy and
legislation with respect to nutrient discharge and control in the Black Sea region, i.e.
the development of draft framework nutrient reduction plans (national and regional)
for implementation over the next five years, and (c) technical support to develop
process, stress reduction and environmental status indicators to determine the
effectivene ss of the strategies employed for nutrient reduction (this report). Both
reports will be presented at Black Sea Basin Stocktaking Meeting in Istanbul PIU in
June 29-30th 2000.
In order to bridge legal and political issues relating to the function of the existing
conventions and the two Commissions, the GEF are funding as part of the PDF, a
`principle of cooperation' in the form of a `Memorandum of Understanding' between
the ICPBS and the ICPDR on common strategic goals. The Memorandom of
Understanding will not however constitute a legal document for the joint
implementation of issues relating to pollution control within transboundary waters and
the wider basin. In brief, the draft document provides the following strategic goals: (i)
a long term goal of nut rient reduction (and hazardous substances) to a level which will
allow the ecosystem to recover (1960s level), (ii) an intermediate goal not to exceed
levels of nutrients (and hazardous substances) above levels encountered in 1997, (iii)
to reach agreement on a common methodology for a monitoring approach, including
sampling and AQC procedures; (iv) to further assess the nutrient (and hazardous
74
substances) input loads and the ecological status of the Black Sea and the Sea of
Azov, (v) to adopt strategies of economic development which are in line with optimal
ecosystem functioning, and (vi) to adopt strategies for limitation of discharge of
nutrients and hazardous substances, with review in 2007.
1.1.4 Key stakeholders
It is important to stress that the com ponents within the process of nutrient reduction as
stated above will ultimately represent all sectors of society. This is ultimately
important since, as is stated in the SAP for the Black Sea, `participation of all sectors
of society is an essential requirement for the development of sustainable policies in
the region.' With respect to public sector involvement, the GEF PDF grant does
accommodate projects from NGOs within a `small-grants' programme. It is
understandable and timely to involve NGOs at this stage of the process, with a view to
general public awareness within the near future, especially in respect of consumer
practice. Representatives from agricultural and relevant industrial sectors will need to
be briefed on the proposal for the basin-wide reduction of nutrients at the earliest
opportunity, since their cooperation within the overall process is vital.
Working alongside agricultural/industrial stakeholders may prove to be key to
achieving nutrient reduction goals. For example, with respect to the industrial sector,
how easily achieved and enforceable is a ban on the use of polyphosphates in
detergent formulations without the involvement of the detergent industry? In the EC,
the detergent industry proposed a voluntary Code of Good Environmental Practice in
1998 (Reynolds, 1997), which was marketed as a Community wide effort to educate
consumers to use detergents correctly. The EC subsequently accepted the Code in
principle as a supplement to legislation. During the next five years, and as one
objective of the Code, the detergent industry aim to reduce the amount of non-
biodegradable chemicals (e.g. polyphosphates) within their formulations by 10%. The
proposal of a 10% reduction can be shared on a Community�wide basis, which allows
the detergent industry flexibility in certain market sectors. The policy should result in
a progressive reduction rather than an outright ban on chemical additions such as
polyphosphates Furthermore, since the cost of phosphate removal in detergents is
undoubtedly passed on to the consumer, is it realistic within the present Black Sea
basin economy to believe a total ban on polyphosphates in detergents is a viable
option?
Another example of successful co-operation, in relation to nutrient control, can be
seen by the N orth Carolina Environmental Management Commission (EMC). In 1989
the EMC designated the Pamlico-Tar basin as a Nutrient Sensitive Water. The
classification, based on years of detailed nutrient loading studies, required the
development and implementation of a strategy to manage both point and non-point
nutrient sources to meet water quality goals.
The North Carolina Division of Environmental Management (NCDEM) responded by
developing stricter nitrogen and phosphorus effluent standards for dischargers in the
basin. However, dischargers were concerned about the high capital costs that might be
required to achieve the nutrient reduction goals. Consequently, a coalition of
dischargers, working in cooperation with the Environmental Defence Fund, the
Pamlico-Tar River Foundation, and NCDEM, proposed a nutrient trading framework
through which dischargers can pay for the development and implementation of
75
agricultural best management practices (BMPs) to achieve all or part of the total
nutrient reduction goals. The EMC approved the program in December 1989, and the
implementation phase (Phase 1) is currently under way. As a condition of EMC's
approval, the discharger coalition agreed to fund the development of an estuarine
model. The model will be used as a tool to evaluate specific nutrient reduction
strategies for the basin. This information will then be used to revise effluent nutrient
standards for Phase 2 of the project. The nutrient trading program is proving to be a
popular solution, largely because it achieves the state's nutrient reduction goals and
addresses non-point loadings while also reducing the economic burden to municipal
dischargers.
1.2 Process and Stress Reduction Indicators to Monitor the
Performance of National Nutrient Reduction Action Plans
within the Black Sea Region
1.2.1 General Objectives
As outlined in Section 1.1.2, in the short term, the actions which are required to
maintain (or reduce) nutrients (and hazardous substances) to 1997 levels fall upon the
agricultural, industrial and municipal sectors. In all cases these sectors encompass
issues relating to legislation, research and integrated monitoring. In order to define the
indicators for process and stress reduction, it is important firstly to define, in broad
terms, the common regional actions required to be undertaken by each of the three
sectors in order to achieve the programme goals.
The following actions were outlined during a Workshop held at the PIU in Istanbul
(31st March � 1st April) to discuss eutrophication-related legislation, policies and
practices:
Agricultural Sector
Main Problem:
� Inadequate land management and improper agricultural practices
related to the fertilizers - organic and inorganic application
Actions:
�
The implementation of Good Agricultural Practice (GAP), the provision
of training
�
Mechanisms for control of nutrient application
�
Mechanisms for sustainable land management
�
Strategy for manure disposal/application and organic farming
�
Development of methodological approach to determine nutrient
requirements
Industrial Sector
Main Problem:
� Ecologically unsustainable industrial activities - improper WWTP technical
facilities
76
Actions:
�
Introduction of Best Available Technologies (BAT) for point discharges
�
Introduction of Best Environmental Practice (BEP) for mitigation of
diffuse pollution
� Work towards phosphorous removal in detergent formulations used in the
region
Municipal Sector
Main Problem:
� Inadequate management of waste water and solid waste; limited or
inadequate connection wit h WWTP for all communities - direct waste
water discharges from some cities directly or indirectly to the Black
Sea
Actions:
� Improvement of waste water and solid waste management to reduce point and
diffuse sources of nutrients
� Provision of an adequate connection of national population to sewerage with
treatment facility.
A current review of the national policies and legislation is presently being undertaken
within the framework of the PDF � Block B programme under Activity 2 and at the
time of writing this report was not completed. Issues relating to research efforts are
also not covered in this present document since their definition will depend on the
final outcome of the development of nutrient related legislation. The issue of
integrated monitoring to provide information concerning the trend over time of
nutrient impact within the ecosystem is detailed within Section 2 of this report.
1.2.2 Potential indicators for the agricultural sector
Control of run-off from agriculture enterprises and livestock operations is a central
element in the short and longer -term strategy to restore the balance and health of
Black Sea habitats and biodiversity. Measures to reduce nutrient run-off from
agricultural activities can be classified into three types: (i) reductions in application of
chemical fertilisers and manure; (ii) changes in the arable land use towards crops
reducing nutrient leakage, and (iii) changed practices for manure treatment.
Since 1990 the retail price of inorganic fertiliser has increased markedly in the Black
Sea region, resulting in a drastic reduction in fertiliser use. By means of example, in
Romania, the use of inorganic fertiliser has decreased from about 140 kg/ha to about
30 kg/ha, and presently nitrogen application represents only about 25% of crop
requirements. In addition, between 1992 and 1996 the head of livestock in the Black
Sea region was also significantly reduced, resulting in a closure of farms or a marked
reduction in activity.
It is important to stress that a revitalisation of the agricultural sector will only be
compatible with a programme of nutrient reduction if following measures are
considered:
77
� Minimisation of erosion and other causes generating diffuse pollution
sources of nutrients, i.e. buffer zone extension, wetland and floodplains
restoration;
� Introduction of sustainable agriculture production - agricultural
production on pilot farms; guidelines, training system for farmers -
manure application/ disposal; promotion of equipment for manure
storage and spreading; market for the waste from livestock;
development of manure management
� The implementation of appropriate economic instruments to control
nutrient export to waterbodies (review provided in Appendix C)
With respect to land use, measures that favour nutrient reduction include: (i) increases
in the area for set-aside, catch crops, energy forest and extensively used agricultural
land. Changes in manure treatment imply a change in the spreading time of manure
from autumn to spring. Application of manure in autumn us ually implies higher
leaching than during the rest of the year since there are no crops available to makes
use of the nutrients. Conservation tillage is considered to be the best measure to leave
more crop or residue cover and thus minimise soil erosion. The establishment of
buffer strips along waterways and shorelines is a sensible measure to decrease the
velocity of surface runoff, thus reducing transport of eroded material. However, the
success of buffer strips is reduced when sited on steeply sloping gr ound and they are
better suited to reducing particulate export during continuous low -level rainfall than if
the same amount of rain falls in a series of irregular storm events. Phosphorus runoff
by erosion would be further controlled by increasing the phos phorus surplus from
fertilizer and manure applic ation.
Following the development of a national institutional framework for integrated water
and land management, it will be essential in the short-term to develop guidelines for
sustainable agriculture practices backed-up with training programs targeted at both
regulators and the farming community. A longer-term change in agricultural practice
will be aided by conducting pilot projects to demonstrate the improved storage and
application of chemical and natural fertilizers, constructions of model storage and
treatment facilities and testing of new equipment for manure spreading.
To determine the impact of national nutrient reduction action plans on the agricultural
sector, baseline and status monitoring will be required. This will include (i) a detailed
soil survey of the catchments, (ii) yearly survey of land-use and fertilizer practices,
and (iii) an analysis of water and nutrient discharges from all parts of the hydrological
cycle.
In each catchment, soil profiles will require analysing for phys ical and che mical
properties (texture, water retention, total carbon, total nitrogen, and organic matter
content). From the data collected, detailed soil maps (topsoil and subsoil) can be
produced and connected to hydro-geological properties of the catchments, based on
existing soil classification and other infor mation. The maps will serve to facilitate a
description of individual field types in the catchments.
Information on land use and agricultural prac tice may be obtained by a yearly survey
(questionnaire) to the farmers covering prac tically all farms in the catchments. The
78
questionnaires will need to provide information on two levels: (i) Farm level: Land
area, land use, soil type, drainage, point loadings. Livestock units, production of farm
yard manure/slurry, storage capacity of farm yard manure/slurry, and (ii) Field level:
Crops, catch crops, yields, use of straw/crop residues, "green fields", and dates of
field activities including application of fertilizers and manure/slurry.
The programme will also need to include measurements of climate and water and
nutrient flows in soil water, drainage water, ground water and stream water.
In order to assess the data in relation to the pressure applied by national nutrient
reduction action plans, an empirical model for the Environmental Integrated
Assessment on eutrophication will be required. Such a model will need to provide an
estimate of the annual nutrient leaching under standard and actual climatic conditions
within an entire catchment area. In addition, it is required that the model provides a
measure of the benefit and disadvantages of nutrient leaching in scenarios with
different agricultural practices.
1.2.3 Potential indicators for the industrial sector
The industrial sector is commencing a period of great transition. The withdrawal of
most subsidies coupled with the need to pay for materials in hand currency is having a
dramatic effect on this sector. Some major polluting industries have been forced to
reduce production by between 30-50% and, as a consequence, there has been dramatic
reduction in industrial waste generation and energy consumption.
In the light of an economic upturn, the primary initiative of the regulatory authorities
that are responsible for the industrial sector will be to provide an institutional and
legal framework for the implementation of the Best Available Technologies (BAT)
for the point discharges and Best Environmental Practices (BEP) in the case of diffuse
pollution prevention, in order to reduce the nutrient load and hazardous substance
discharges into surface waters. Monitoring of the process will require the
development and implementation of procedures for compliance monitoring with
respect to nutrients and hazardous substances. The main outputs expected are clean
technologies and abatement for pollution of water and pre-treatment facilities of
industrial (food processing, fertilizers) wastewater.
In order to meet national nutrient targets, the recovery of industrial activity must
marked by developments focused on construction, reconstruction and modernisation
of existing technologies, including pre-treatment and process facilities. Thus, it would
be essential to review existing process and treatment facilitie s, devise suitable
strategies for upgrading industrial facilities and draw -up pre-investment proposals.
The process of upgrading facilities would be expected to start within the 5-year
timeframe of the national nutrient reduction action plans.
Special attention should be paid for the phosphorous free detergent production/ import
for the market. Liaison between national representatives and the detergent industry
would be beneficial initially to review national detergent usage and prioritise
products/formulations for review. In line with European initiatives, it may be useful to
agree an Environmental Code of Practice between the national regulatory authorities
and the detergent industry for the duration of the national nutrient reduction action
plans (i.e. 5 years). Such a `non-binding' agreement could pave the way for a change
to P-free detergents in the market by year 2005.
79
1.2.3 Potential indicators for the municipal sector
In the municipal sector, the overriding action required is to improve the management
of wastewater and solid waste in order to reduce the point and non-point emissions of
nutrients. Of highest concern is the population within the region that are connected to
a sewerage system (albeit ineffective) but lack adequate treatment facilities.
Municipal treatment of domestic sewage within the Black Sea region ranges from
primary to secondary treatment. Sludge treatment may involve drying beds or lagoons
in smaller communities and anaerobic digestion in larger localities. Tertiary treatment
for N and P removal is practically non-existent. Although previous investments within
the region concerning municipal wastewater treatment have been substantial, they are
reported to be less effective than expected, a fact that is partly due to a lack of
adequate investment planning. The down turn of the economy has inevitably led to a
marked reduction to any new investments in treatment plants, and financial shortfalls
make it hard for many industries and municipalities to operate and maintain existing
plants adequately.
Of primary concerns in the municipal sector are (i) the maintenance and upgrading of
the sewer networks, (ii) the upgrading and maintenance of existing WWTPs, and (iii)
where necessary, the construction of new treatment facilities. Addressing these wide -
ranging needs will require a strategy for phased increase of public supply connection
to sewerage system together with the identification of the requirements of WWTPs in
each municipality. Where necessary, construction of solid and liquid waste facilities
will need to be identified and their need prioritised. Such a strategy will also be
required to take into account the incidence of direct discharge of municipal
wastewaters in each country and propose adequate methods of pollution abatement.
The completion of a pre-investment plan for construction and maintenance of sewer
delivery system and upgrading/construction of WWTPs should permit for the
establishment of connectivity and adequate treatment for 95% of municipalities with
population over 5,000 by 2005, with treatment of waste waters applied in 75% of
settlements with population over 5000 by the year 2010.
One issue facing many municipal wastewater treatment plants is the discharge of
insufficiently treated industrial wastewater. A revision of regulations concerning
treatment of trade waste and WWTP effluent standards is required. Enactment and
enforcement of regulations and standards for pre-treatment of commercial/ industrial
waste entering municipal sewerage system together is a prerequisite to obtaining
satisfactory effluent discharge.
With respect to achieving adequate wastewater treatment in rural areas, the design of
a programme of action will need to both review present status of rural wastewater
management and also devise strategy in view of environmental and economic impact.
Demonstration programmes would inevitably act as an aid to heighten public
awareness.
80
Table 1.1
Summary of Process and Stress Indicators
ACTION
INDICATOR
TYPE1
COMPLETION 2000+
Agricultural Sector
01 02 03 04 05
1. Review of current policies for integrated
approach in water resources and land
management:
�
Development of a national institutional framework for integrated water and land
P
X
�
Preparation of guidelines for
management
catchment management planning
�
Completion of training courses for catchment management planning
P
X
�
Provision of training courses
�
Development of demonstration pilot projects
SR
X
�
Introduction of sustainable land
�
Integrated management of river basin achieved by 2010
SR
practices
2. Minimisation of erosion and other causes
generating diffuse pollution sources of
nutrients:
�
Development of a national action plans for forestation, buffer zones, wetland
P
X
�
Forestation plan development and
and floodplain restoration � identify sensitive/vulnerable catchment areas �
implementation
identify necessary rehabilitation/protection plans
�
Buffer zones planning and
�
Development of demonstration pilot projects
SR
X
development
�
Implementation of plans - extension of buffer zones (50%?) by year 2005
SR
X
�
Wetlands, floodplains restoration
and protection.
81
3. Introduction of sustainable agriculture
production
�
Development of a plan to enhance organic farming practice
P
X
�
Agricultural production on pilot
�
Complete training courses for GAP for farmers
P
X
farms
�
Establish a mechanism for the control of inorganic fertiliser
SR
X
�
Guidelines, training system for
application
SR
X
farmers - manure application/
�
Provide mechanism/incentive to promote the use of equipment for
disposal
manure storage and spreading
SR
X
�
Promotion of equipment for manure
�
Establish guidelines for the application and disposal of manure
SR
X
storage and spreading
�
The N, P total fertilizer consumption stabilized at the level of 1997
SR
X
�
Market for the waste from livestock
�
By the year 2005, 50% of all animal farms with over 1000 livestock
�
Development of manure
unit should be equipped with WWTP and by the year 2010 this figure
SR
X
management
should reach 70%.
�
Reduction of the agriculture target group weight in the nutrient
emission balance to 25% by the year 2005
4. Control of run-off from agricultural enterprises
�
Develop a national strategy for the reduction of pollution from
P
X
and livestock operations
agricultural run- off
�
Develop suitable methodologies for diffuse pollution assessment
P
X
�
Decrease of the nitrate concentration in the ground water
SR
X
5. Monitoring of nutrient application norms
�
Baseline measurements undertaken
ES
X
and compliance with recommended
�
Selection of appropriate empirical model for data assessment
P
X
procedures
�
Status monitoring completed
ES
X
Industrial Sector
1.Provide an institutional and legal framework for
�
Adoption of legal framework
P
X
implementation of BAT and BEP and regulation
�
Development of institutional framework
P
X
of installations with respect to control of
�
Adoption of effluent standards/normatives and enforcement
P
X
nutrients and hazardous substances.
procedures
SR
�
Decreasing pollution in line with BA T and BEP by year 2010, by the
construction of pre -treatment plants
82
2.Development of projects focused on
�
Review existing process and treatment facilities
P
X
reconstruction and modernisation of
�
Devise strategy for upgrading industrial facilities
P
X
existing technologies including treatment
�
Complete investment proposals
P
X
and process facilities
�
Initiate upgrading procedure
SR
X
3. Where necessary, construct solid and
�
Complete priority list for capital investment
P
X
liquid waste treatment facilities, including
�
Complete national investment proposals
P
X
where necessary for pre-treatment.
�
Initiate construction - decreasing pollution in line with BAT and BEP
SR
X
by year 2010, by the construction of pre-treatment plants
4.Design of solid waste disposal facilities
�
Complete review to determine the most appropriate method of sludge
P
X
for sludges containing phosphate, i.e.
disposal � quantify problem and propose solutions
landfill containment
�
Complete demonstration pilot study
S
X
5.Reduction of phosphate content of
�
Initiate liaison between national representatives and the detergent
P
X
industrial and domestic detergent
industry to review national detergent usage and prioritise
formulations
products/formulations for review
�
Agree a 5 year Environmental Code of Practice between the national
P/SR
X
regulatory authorities and the detergent industry aimed at a change to
specified P -free detergents in the market by year 2005
�
Implement updated national legislation
P
X
6.Develop and implement procedures for
compliance monitoring with respect to
�
Complete a strategy for a permitting and charging scheme for
P
X
nutrients and hazardous substances
pollution prevention and control � peer review
�
Enforce permitting/charging scheme
SR
X
Municipal Sector
83
1. Optimise operation and maintenance of
�
Complete strategy to increase the connection of public supply to
P
X
sewer system
sewerage system
�
Complete pre - investment plan for construction and maintenance of
P
X
sewer delivery system
�
Initiate construction - extension and improvement management of
SR
existing sewerage system and establishment of new ones achieved in
95% of municipalities with population over 5000 by 2005 - treatment
of waste waters applied in 75% of settlements with population over
5000 by the year 2010
2. Up- grade treatment capacity
�
Complete strategy to impr ove operations and maintenance of existing
P
X
�
Improve operations and maintenance of
WWTPs
P
X
existing WWTP
�
Complete pre - investment plan for upgrading and maintenance of
SR
X
�
Apply appropriate sludge treatment
WWTPs
and disposal
�
Initiate operations
3. Where necessary, construct Wastewater
�
Complete priority list for capit al investment
P
X
treatment facilities
�
Complete national investment proposals
P
X
�
Initiate construction
SR
X
4. Eliminate direct discharges without
�
Complete survey of all national municipal discharges with inadequate
P
X
appropriate treatment
treatment facility
�
Complete strategy for elimination of direct discharges � link pre-
P
X
investment plan to 1 and 2 above
�
Initiate operations
SR
X
5. Enactment and enforcement of regulations
�
Revise regulations concerning treatment of trade waste and WWTP
P
X
and standards for (i) pre-treatment of
effluent standards
commercial/ industrial waste entering
�
Adoption of standards/normatives ( for pre-treatment as point 1 �
SR
X
municipal sewerage system, (ii) effluent
Industrial Sector above)
standards from municipal WWTPs
6. Implement programs for environmentally
�
Review present status of rural waste water management and devise
P
X
sound individual waste water
strategy in view of environmental and economic impact
management system to rural areas
�
Initiate a demonstration programme to heighten public awareness
SR
X
84
7.Develop a monitoring programme for
WWTPs
�
Propose a monitoring strategy for WWTPs - peer review
P
X
�
Implement monitoring programme
SR
X
1 Indicators:
P = Process;
SR=Stress Reduction;
ES = Environmental Status (in relation to agricultural activities only)
85
2.
ENVIRONMENTAL STATUS INDICATORS
2.1 Preamble
This section provides (i) a definition of eutrophication, (ii) a brief overview of the
behaviour of nutrients in coastal waters together with the factors affecting the
expression of elevated nutrient levels as eutrophication' (iii) lessons learned from
previous monitoring programmes, (iv) potential indicators
A preliminary set of Black Sea ecosystem indicators for monitoring the environmental
status is suggested in the final chapter.
2.2 Definitions
Providing a definition of eutrophication which can be applied to the Black Sea and be
used as a basis for monitoring is more complex than may at first be considered, since
indicators can include chemical, biological and physical parameters. The problem
stems from the fact that different legislators and scientists have failed to adopt a single
definition of eutrophication, with literally hundreds of definitions having been
proposed in the past.
The definition of eutrophication that now receives the greatest attention in EU
Member States is the version laid down in the Nitrates and Urban Waste Water
Treatment Directives, viz:
"the enrichment of water by nutrien ts, especially compounds of nitrogen
and/or phosphorus, causing an accelerated growth of algae and higher plant
life to produce an undesirable disturbance to the balance of organisms
present in the water and to the quality of the water concerned."
This has resulted in the underlying causes of eutrophication recently being considered
only in terms of excess nitrogen or phosphorus (even though the EU definition does
not exclude other nutrients). However, much of the work undertaken in the Black Sea
during the past 10-20 years has considered eutrophication to be due to excessive
organic loading. For example, Mee (1999) defines eutrophication as "the over-
enrichment of water bodies with organic matter". Other authors (e.g. Parr and
Wheeler 1996) have considered marine/estuarine eutrophication in terms of nitrogen
and phosphorus (and sometimes silicate), while admitting that distinguishing between
the impacts of N and/or P enrichment and organic enrichment is very difficult, if not
impossible. This is the reason for Nixon (1995) proposing a trophic classification
scheme for tidal ecosystems based on organic carbon supply.
The problem stems from the fact that organic loading can be due to:
1.
Increased growth of algae and higher plants which, in turn, contributes
to increased water column BOD levels. Upon death, these plants also
increase the sediment oxygen demand.
86
2.
Increased organic loading from external sources, e.g. direct discharges
into the marine environment via outfalls and fluvial fluxes.
Thus, even if external organic loads do not increase, providing external loads of N and
P increase, the organic load generated within a waterbody will increase. However,
while it is relatively easy to monitor external loads of N and P, external organic loads
are very much more difficult to monitor, since a greater proportion of the organic
loads is associated with sediment bed-load than it is for nutrients.
In general terms, the first organisms to respond to N and P enrichment are primary
producers (plants), and in particula r microalgae because of their rapid rate of growth
(a typical doubling rate of 2-3 days under ideal growth conditions). Microalgae
(planktonic or sediment-dwelling) can therefore be considered the most sensitive
indicators of nutrient enrichment. However, the first organisms to respond to
increased organic loading are bacteria. These are present in the water column
(bacterioplankton), but are concentrated in the sediment, and rapidly remove oxygen
from their surroundings when supplied with a source of assimilable organic carbon.
The effect of this is to strip oxygen from the sediment and lower, poorly mixed
waters. This results in a secondary impact on the fauna, and most notably the infauna
(invertebrates living in the sediment, rather than on the surface of it). Thus, if
eutrophication is defined (and ecological impacts monitored) in terms of N and P
enrichment those ecological indicators are likely to be more sensitive to a change in
trophic status than if eutrophication is defined in terms of organic enrichment, since a
primary rather a secondary impact is monitored. As chemical water quality improves,
the initial recovery will be noted in terms of primary impacts, with a lag period before
improvements in secondary effects is recorded.
In this report, eutrophication is defined in terms of the biological expression of
excessive N and/or P levels (primarily in terms of increased plant growth), albeit that
animal indicators are discussed because of the oxygen-depletion caused by increased
primary productivity.
2.3 Nutrients and Coastal Waters - an overview
2.3.1 Limiting nutrients
Two macronutrients are commonly referred to as being potentially limiting in marine
coastal waters: nitrogen and phosphorus. In this paper the term 'limiting nutrient' is
defined as any nutrient, which if present in greater concentrations would stimulate
algal growth. However, care should be exercised over the use of the word 'limiting',
since another factor (often light) usually has a more limiting effect on
algal/macrophyte growth
At N:P ratios of <8 (w/w) nitrogen is said to be limiting, and at N:P ratios of >8 (w/w)
phosphorus is said to be limiting. The cut-off value of about 8 (the so-called Redfield
ratio) varies between algal species, albeit with most species falling within the range 6-
10, and is based on the ratio of total N:total P found in a `typical' alga growing in
ideal conditions (e.g. OECD 1982). In wetland ecosystems (bogs, fens, wet
heathlands, dune slacks and wet grasslands) an N:P ratio of 15:1 is more typical of
higher plants (Koerselman and Meuleman 1996).
87
Other nutrients have also been reported to limit algal growth, of which silicon is
probably the most widely reported, albeit in a different manner to nitrogen or
phosphorus. With silicon, the growth of only certain types of algae is limited, so a
shortage of silicon tends to affect what grows, rather than how much grows. Reports
of algal growth being limited by a shortage of micronutrients, such as vitamin B12,
are much less frequent and tend to be species-specific, typical of, e.g. auxotrophic
flagellates.
Within the past decade, there has been increased discussion over the possible
limitation of phytoplankton growth by a shortage of iron, particularly with regard to
diatoms, in oceanic waters and warmer climates (Martin et al 1994). Phytoplankton
require more iron than any other trace metal (Wells et al 1983), since it is a cofactor
for many enzymes, notably with regard to oxidase systems (i.e. the oxygen evolution
step of photosynthesis). However, coastal waters tend to contain higher levels of iron
than the open sea, since land is a major source of this metal, as it is for nitrogen and
phosphorus. It is therefore considered unlikely that low iron levels would be a major
factor limiting algal growth in the B lack Sea.
The expression of increased nutrient levels as increased algal biomass is a highly
complex process which is controlled and mediated by many variables. The mode of
action by which increased nutrient levels affect plant species distribution and standing
crop may be responsible for nature conservation concerns which are not recorded by
traditional methods of monitoring trophic status, such as water column chlorophyll-a
levels (see Parr et al 1993 for a review). For example, changes in denitrifying
bacterial populations brought about by increased nutrients may impact directly on
heterotrophic bacteria in light-limited areas.
2.3.2 Nutrient sources
The greatest source of nutrients in oceanic waters and associated seas is the water
itself. For example, the ISSG (1990) estimated that 99.99% of the nitrogen input to
the Irish Sea is from the Atlantic. However, in enclosed seas, particularly those with a
very shallow tidal range (such as the Black Sea), land represents by far the greatest
source of nutrients. These nutrients can enter the sea directly via
� Fluvial fluxes from rivers draining the catchment (these also carry
nutrients that are discharged directly into the rivers).
� Surface runoff from riparian land.
� Direct discharges of waste from coastal communities and industrial plants.
� Submarine groundwater discharges (similar to baseflow in rivers).
� Atmospheric deposition (likely to be an important route of entry for
nitrogen, but much less important for phosphorus).
2.3.3 Nutrient cycling
Several recent reviews of coastal/estuarine nutrient cycling and ecological impacts are
available (e.g. Parr et al 1999, Scott et al 1997). It is not intended to repeat their work
here, but a brief overview of the major processes involved in nutrient transformations
will highlight the complexity involved in monitoring particular nutrient species as an
indicator of trophic status.
88
It should also be remembered that the construction of large reservoirs in rivers
dramatically affects the nutrient content of the rivers flowing out of those reservoirs,
since these reservoirs function as enormous bioreactors and settling tanks. Therefore,
reservoirs greatly reduce the nutrient content of rivers. Similarly, if water is abstracted
from rivers for irrigation, by the time this water has returned to river, much of the
phosphorus contained within it will have been stripped out by soil and plants. With
nitrogen the situation is more complicated, since historic over -fertilisation with
inorganic nitrogen fertilisers and the fact that nitrate binds much more weakly to soil
than phosphorus, mean that less nitrogen would be retained in crops and the soil
profile.
2.3.3.1
Nitrogen
Marine water nitrogen dynamics, as in other waters are dominated by a number of
well-defined processes (Sprent, 1987):
� Nitrification - the conversion of ammonium to nitrate (via nitrite). This is
dependent on the presence of both nitrogen and oxygen, and is therefore
inhibited in anoxic environments, such as in the sediment and lower
waters of the Black Sea. Nitrification may occur primarily at the sediment-
water interface or in open water. It may also shift between the two as
oxygen at the sediment-water interface is depleted.
� Denitrification - the conversion of nitrate to molecular nitrogen via
ammonium. In temperate climates this is highly seasonal, even when
significant populations of appropriate bacteria are present. Denitrification
occurs primarily at the sediment-water interface. The major loss of
nitrogen from marine waters to the atmosphere occurs via the release of
gaseous N2 and N 2O.
� Mineralisation (ammonification) - the process by which complex organic
nitrogen is metabolised to ammonium. This process is undertaken
predominantly by the microbial population, but in recent the important
role of benthic fauna in increasing the breakdown rate of organic nitrogen
has become better understood (see Scott et al 1997). Mineralisation may
occur in the water column, but is more important in the sediments.
Likewise, the importance of mineralisation in supplying nitrogen to
benthic algae is now becoming clear (Jeffrey e t a l 1991, 1995).
� Ammonia assimilation - the uptake and conve rsion of ammonia to
organic nitrogen by plants (predominantly phytoplankton) and microbes.
� Nitrate assimilation - the conversion of oxidised nitrogen (nitrite and
nitrate) to organic nitrogen by plants (predominantly phytoplankton) and
microbes.
� Nitrogen fixation - the conversion of molecular nitrogen to ammonium
and, ultimately, to oxidised and organic nitrogen. This is an energy-
expensive process that tends to occur when combined nitrogen (nitrate,
ammonium, urea, etc.) levels are low.
89
Other processes such as dissimilatory nitrate reduction (the use of nitrate as an
electron acceptor in respiration instead of oxygen by some bacteria and plants) are
unimportant by comparison.
Thus, while inorganic nitrogen is immediately available to fuel algal growth, organic
nitrogen may rapidly be mineralised to a bioavailable form. This is especially the case
where plankton are the major plant biomass, since following the collapse of algal
blooms, dead phytoplankton cells are more rapidly broken down (mineralised) than
macroalgae or higher plants.
This means that although levels of inorganic nitrogen may be low due to rapid DIN
assimilation rates, algal productivity may be very high if mineralisation rates are
sufficient to ensure rapid cycling of organic nitrogen. The rate at which mineralisation
occurs is dependent on local factors (mixing, nitrogen speciation of major inputs,
etc.), but the higher the temperature, the more important organic nitrogen is likely to
be in determining algal productivity. As a `rule of thumb', for every 8-10 �C increase
in temperature, a doubling of both algal and bacterial activity (growth rate) occurs.
2.3.3.2
Phosphorus
The phosphorus cycle in coastal marine waters is mediated by the amount of
orthophosphate present in the water column, in a similar way to which
ammonium lies at the heart of the nitrogen cycle. Orthophosphate is
assimilated by phytoplankton, and converted to organic phosphate that is later
(after death) mineralised. Mineralisation of organic phosphate may take place
in the water column but, more importantly, occurs in the sediment, from
which the release of orthophosphate is enhanced at low dissolved oxygen
levels. Thus, phosphorus recycling is greatly affected by thermal/saline
stratification and the organic content of sediment.
2.3.4 Organic carbon
Assimilable organic carbon (AOC, bioavailable carbon) is at the centre of the carbon
cycle. Unlike ammonia in the nitrogen cycle, AOC, is only rarely measured (and then
usually only in potable water), and consists of a broad array of compounds. Most of
these are low molecular weight compounds e.g. carbohydrates such as glucose, but
some microbes e.g. Actinomycetes, are able to break down and take up hig h
molecular weight compounds as smaller, simpler molecules. These low molecular
weight compounds are then metabolised into the high molecular weight organic
compounds that form the majority of the dry weight of microbes, the organisms that
feed on them, and so on up the trophic ladder.
Since the early part of the 20th century, a surrogate of AOC has been measured in
environmental monitoring programmes � biochemical oxygen demand BOD5. This is
the amount of oxygen consumed within a 5-day period by a sample of unfiltered water
under aerobic conditions at 20�C. If the microbial count in the water sample is low to
start with, a bacterial inoculum may also be added. In addition, allylthiourea (ATU) is
also added to prevent oxygen uptake by nitrification. BOD5 has been heavily
criticised as an oxygen uptake test, and in its wider role as a broad-scale test of
environmental health, particularly because of the phenomenon of `sliding BOD'. This
occurs when toxicants are present in high enough concentrations to inhibit microbial
growth. In such cases, by diluting the environmental sample with distilled/deionised
90
water, a higher BOD result will be obtained. This is a particular problem in toxic
industrial effluents.
In addition, although the 5-day incubation period was chosen, since that is when the
BOD plateau is reached in most aquatic samples, in situations, such as the Black Sea,
the most appropriate theoretical test would be BOD. Even though the rate of oxygen
uptake may decrease greatly after 5 days in most samples, in some samples the total
amount of oxygen which can be consumed during the following month, year, etc, can
be higher than that consumed within the first 5 days. For this reason, when modelling
the dissolved oxygen status of lakes and coastal waters, it is normal to divide BOD
loads into BODfast and BODslow.
A variety of alternatives to the BOD5 test have therefore been proposed, such as
chemical oxygen demand (COD), total organic carbon, suspended solids, and a range
of different bioprobes/biomonitors (Parr 1992a). The latter can give an immediate
result, rather than the 5 days BOD incubation period � important for process control
in sewage treatment works and the chemical/food industry.
2.4 Lessons learnt from previous trophic status monitoring
programmes
Even if a nutrient reduction plan is successful, so external nutrient loads to
the Black Sea are reduced within 5 years, this is no guarantee that ecological
improvements will become apparent over the same timescale. The reasons for
this are expla ined below.
2.4.1 Physical and Biological Factors
Parr and Wheeler (1996), in an assessment of the impact of nutrient levels within (and
nutrient loads to) 12 English tidal waters areas, reviewed the biological and physical
factors which affected eutrophication of tidal water ecosystems. These included:
� Turbidity (depth of light penetration - examined in more detail by Parr et
a l 1997).
� Depth of mixing.
� Bathymetry.
� Windspeed and direction.
� Coriolis force.
� Freshwater volumetric input.
� Marine water volumetric input (tidal range).
� Temperature.
� Biological growth rate.
� Grazing pressure.
These factors in themselves are pertinent to the understanding of tidal/marine
eutrophication, since they control the biological expression of changing nutrient levels
as eutrophication (increased primary productivity, leading to increased secondary,
tertiary, etc. productivity higher up the food chain. Because so many factors are
involved in relating nutrient status to trophic status, any prediction of trophic status
91
from nutrient status necessarily has wide confidence limits. For example, in
freshwater lakes, the 95% confidence limits for predicting chlorophyll-a levels from
total phosphorus levels are an order of magnitude apart (OECD 1982). In marine
waters, similarly wide confidence limits have been reported (e.g. Gowen et al 1992),
although the introduction of a `flushing factor' to these simple linear relationship can
improve the confidence associated with such predictions (Parr et al 1995).
However, it should be recognised that while such simplistic linear relationships
`force' a linear regression through the chlorophyll/nutrient concentration data, the line
which best fits such data is sigmoidal and asymptotic (e.g. McCauley et al 1989). A
number of authors have, therefore, cited nutrient levels (for various types of
waterbody) above which chlorophyll levels do not significantly increase. Although
there is disagreement about the actual concentrations involved (Reynolds 1992), for a
number of lakes the `saturation' level lies in the range 75-150 �g P.l-1 (e.g. McCauley
et al 1989, Prairie et al 1989, Sas 1989). However, this critical level will differ from
one waterbody to another. For example, in waterbodies which are turbid during the
growing season the `saturation' phosphorus limit is likely to be at the lower end of the
range, since shading from suspended sediment will limit algal growth.
Moreover, simple chlorophyll-a/nutrient relationships are usually based on data from
different waterbodies, or from different sites in large waterbodies. These represent
steady-state sites
2.4.2 Alternative Stable States
The concept of alternative stable states has been most widely recognised in lakes, but
in rivers the same process is also apparent (Mainstone et al 2000). In shallow lakes of
low trophic status, primary productivity is dominated by macrophytes, but as nutrient
concentrations increase, the phytoplankton standing crop increases thereby reducing
light availability to these macrophytes. In addition, the standing cop of epiphytic
plants increases (predominantly algae � unicellular [notably diatoms] and
macrophytic/fimamentous [notably Cladophora spp]), further reducing light
availability to higher macrophytes. Ultimately, the higher macrophytes die out due to
light starvation, and the lakes become dominated by phytoplankton. This has
subsequent effects on the fish population, leading to a change whereby fish have a
planktivorous life stage (feeding predominantly on zooplankton rather than
phytoplankton � although some do exist) tend to dominate, together with those fish
which feed on sediment (and the invertebrates contained therein). Thus a second
stable stable state becomes established which, even if nutrient concentrations are
reduced to similar levels to those which occurred when the former stable state existed,
remains the stable state.
The only way to revert to the original stable state is by introducing a biomanipulation
programme as external nutrient loading to the waterbody is reduced. This is achieved
by promoting those animals which feed directly on phytoplankton (e.g. much work
has been done on the introduction of silver carp, Hypophthlmychthis molitrix, Parr
1992b, 1993), or introducing fish species which do not feed on zooplankton (see Moss
et al 1996). Given the sheer scale of the Black Sea, even if alternative ecological
stable states could exist (and there is no evidence for such a change, even though there
is a widely reported change in ecological indicators of trophic status), it would not be
possible to undertake a biomanipulation programme. Current evidence suggests that
large bodies of saline water do not undergo alternative stable states, but it is clear that
92
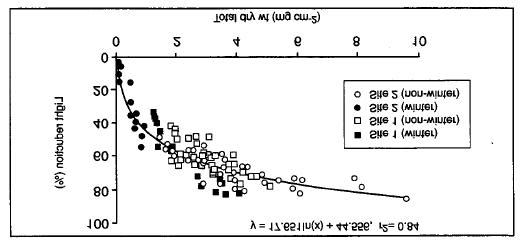
an ecological transition occurs as nutrient status increases (Zaitsev and Mamaev
1997).
With regards to marine environments generally, and the Black sea in particular, it is
likely only to be in shallow coastal waters where two alternate stable states could
exist. However, an obvious change in the maximum depth of colonisation in
macroalgae and hig her plants has been reported as a consequence of eutrophication
from other parts of the world (Parr et al 1997). The factors involved in reducing light
penetration are discussed by Burt et al (1995a) and Parr et al (1997). The effects of
epiphyte biomass on the light availability to an Australian marine sea grass are shown
clearly in Figure 2.1. Moreover, the depth of macrophytic/macroalgal growth is used a
method of monitoring the trophic status of marine waters at the entrance to the Baltic
Sea by Danish scientists (Sand-Jensen et al 1994, Borum 1996) who established the
following relationships as part of this study (Z = depth):
� Zostera: Z(lower colonisation limit) = 0.787 Z(Secchi) + 0.339, R2=0.606, n=101
� Brown macroalgae: Z (lower colonisation limit) = 1.427 Z(Secchi) -1.252, R2=0.584, n=84
� Other macroalgae: Z(lower colonisation limit) = 1.568 Z(Secchi) -1.1, R2=0.638, n=119
2.4.3 Chemical Factors - Internal Loading
It should be noted that this paper deals with eutrophication in the broadest sense of the
word. Consequently, increased organic loadings should also be considered part of the
eutrophication process. This has a far greater impact on sediment infauna than
elevated nutrient concentrations/loadings per se , but must also be considered in the
context of sediment type with regard to particle size.
Figure 2.1
Relationship between periphyton biomass and light reduction to host artificial
seagrass plants (Burt et al 1995b)
2.4.4 Seasonality
Nutrient concentrations in tidal/marine waters and externa l nutrient loads to those
waters exhibit pronounced seasonality in temperate climates. Within the Black Sea
itself, nutrient (N and P) concentrations will peak in winter and be at a minimum in
summer. The reasons for this are associated with:
93
� Primary productivity � at a peak during longer, more brightly lit days in
summer, so increased amounts of nutrients are sequestered by plants
(predominantly algae and most importantly, phytoplankton).
� As the phytoplankton population, benthic/marginal macroalgal and higher plant
communities decline during late autumn/winter, nutrients sequestered within these
organisms are released into the water column or sink to the seabed. These are then
mineralised and re-released into the water column over winter.
� Stormy weather results in deeper areas of sediment being mixed into the water
column, mixing nutrient -rich interstitial water into the main water column.
� Stormy weather also contributes to the collapse of perennial macroalgal
populations.
� Freshwater macrophytes, phytoplankton and terrestrial plants lying within the
catchment undergo similar seasonal patterns of growth and senescence increasing
the seasonal nutrient load into rivers.
� The higher levels of rainfall, means that nutrients are flushed from the catchment
into rivers. Nitrogen is exported predominantly by leaching, although losses via
surface runoff can be considerable during/following heavy rainfall events; while
phosphorus is lost predominantly by surface runoff, particularly when this is
linked to soil erosion (Parr et al 1999).
� The increased river flows in winter are partly due to an increase in river velocity.
Particulates that settle out of suspension during low flows are therefore
resuspended during elevated winter flows. This increase in suspended solids is
particularly important for phosphorus, which binds strongly to particulates, but as
in the sea, dissolved N and P in riverine sediment interstitial water is also released
into the water column.
� The above factors always result in increased river nutrient loads in winter, and
where river nutrient budgets are dominated by diffuse sources, the instream
concentration also increases. However, in rivers that are dominated by point
sources, the increased dilution offered by the additional water can, in some cases
result in lower nutrient concentrations.
� Atmospheric deposition of nutrients is likely to be associated with increased
frequency and severity of rainfall.
Depending on the purpose of the monitoring programme, it may therefore be
necessary to monitor throughout the year or only at a particular time of the year.
Instream nutrient loads are always monitored on a continuous basis, with results
usually presented as an annual mean load. However, in terms of trend analysis, it is
vital that confidence limits are also calculated. For nutrient concentrations,
particularly those in marine waters, it is more usual to monitor concentrations only
when they are at a maximum and algal productivity is at a minimum (i.e. during
winter. See, for example Rees et al 1994, Gunby et al 1995). This approach is not
chosen because it necessarily yields the most useful information, but because it
minimises the seasonal variability. Indeed, it is the nutrient concentrations during the
`growing season' (nominally April- September) which are of the greatest ecological
relevance. From an environmental impact point of view, the nutrient concentration in
winter is unimportant, since temperatures are too cold and light availability too
limited for phytoplankton, macroalgae or rooted plants to grow.
In contrast to the monitoring of nutrient levels within the Black Sea, biological
indicators are best monitored when either productivity or standing crops are at a
maximum. Thus, if monitoring the intertidal area occupied by Enteromorpha spp, the
best time of year would be during summer/early autumn when biomass is highest.
94
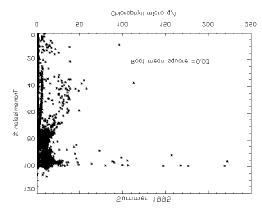
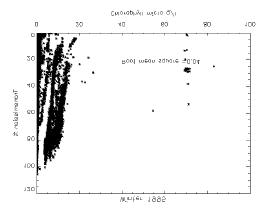
Enteromorpha standing crop is linked to the oxygen status of underlying sediments
and so the density and species composition of sediment infauna. While the primary
productivity of this genus probably reaches a maximum during late spring/early
summer, where nitrogen is limiting the best indicator of maximum standing crop
appears to be the sediment nitrogen mineralisation rate in late spring (Jeffrey et al
1991, 1995).
Physical indicators of trophic status suspended solids are represented by Secchi depth,
suspended solids concentrations and water column light attenuation/transmission.
However, while phytoplankton standing crop (as measured by chlorophyll-a
concentration) may be an important component of light attenuation/transmission at
individual sampling sites, when information from a large number of sampling sites is
included, the relationship between these parameters may be surprisingly weak (Figure
2.2). However, this data is from two single coastal cruises undertaken by the UK
National Rivers Authority (now the UK Environment Agency) � one in summer and
the other in winter - in which water quality was monitored every 10 seconds.
Figure 2.2
Relationship between light transmission and chlorophyll-a levels in English and
Welsh coastal waters during summer and winter 1995, showing R2 value for linear regression
(Parr et al 1997)
In contrast to the conclusion drawn from the above data, Kirk (1994) estimated that in
`idealised' coastal waters containing chlorophyll levels of 1-4 �g/l, some 8.5-27.2%
of water column light in the photosynthetically active range (400-700 nm wavelength)
is captured by phytoplankton. Other workers have also shown light
attenuation/turbidity to be strongly correlated with chlorophyll-a levels (e.g. Prieur
and Sathyendranath 1981).
Nevertheless, according to Parr et al (1997) the results serve to illustrate that it is
better to monitor a smaller number of sites more frequently than a large number of
sites less frequently, in addition to the absolute requirement for good analytical
quality control procedures. Because the results of turbidity-related physical
parameters can change so rapidly and are so strongly influenced by meteorological
conditions (particularly in shallow coastal waters), monitoring needs to be carried out
on a frequent basis. Furthermore, such monitoring should be undertaken at sites that
are not influenced by coastal erosion nor by turbidity plumes from inflowing rivers.
2.4.5 Nutrient bioavailability
An apparent paradox exists with regard to nutrient monitoring and trophic status. In
freshwater lakes the emphasis is on total nutrients (total N and total P), while in rivers
95
impassioned arguments have been made for both total nutrients and bioavailable
nutrients. Similarly in tidal and offshore waters, arguments have been made for both
bioavailable and total nutrients. The debate is based not only on scientific integrity,
but also on finances � the available monitoring budget.
Plants can only grow using bioavailable nutrients, so it may at first seem appropriate
to base a monitoring programme on those chemical parameters most closely related to
bioavailable nutrients, assuming that bioassays themselves are not practicable.
However, while water column SRP and DIN levels may approximate to water column
bioavailable nutrients, and so be relevant to phytoplankton growth, a substantial
proportion of the nutrient budget of seaweeds and benthic diatoms, while still
represented by SRP and DIN, is likely to be obtained from the sediment. For rooted
higher plants (including salt marsh species), the vast majority of their nutrient uptake
is likely to directly from the sediment, and bioavailable nutrient levels in sediment
may be very different from those in overlying water. Indeed it is possible for rooted
salt marsh species to be limited by Nitrogen availability, while phytoplankton growth
in overlying waters is phosphorus limited (and vice versa; see Parr et al 1999).
Furthermore, when considering nutrient concentrations in sediment, an appropriate
sample depth must be chosen. For benthic diatoms, the bioavailable nutrient
concentrations both in the overlying water and in surface sediment interstitial water is
important. However, for deep-rooted macrophytes, it may be more appropriate to
monitor the bioavailable nutrient concentration in interstitial water at 15-50 cm depth.
The monitoring programme for each site should be based on local knowledge of the
flora present.
However, the ratio of total: bioavailable nutrients can change both on a spatial and
temporal basis � hence the reason for external nutrient loads to be measured in terms
of total nutrients, since this represents the potential bioavailable nutrient load, not the
nutrient load at a particular time. For example, only 50% of the total nutrient load
may be in a bioavailable form, but in the future, much of the non-bioavailable nutrient
load may be mineralised to a bioavailable form. This is the reason why the OECD
(1982) trophic status classification of lakes is based on total nitrogen and total
phosphorus, not the bioavailable forms. However, it is the bioavailable forms that
drive productivity in all waters, and hence monitoring of nutrient status of the Black
Sea itself should be under taken in terms of bioavailable nutrients.
2.5 Potential Indicators
A crucial aspect the Black Sea Environmental Programme (BSEP) is the development
of a management framework for maintaining and improving the quality of marine
waters in order to ensure the safety and sustainability of the aquatic ecosystems and
certain specific water "uses". To this effect, a `consultation' document was produced
to provide a framework, based on the concept of Environmental Quality Objectives
(EQOs), for prioritising pollution control activities and to aid in establishing realistic
goals for water and sediment quality improvement (Reynolds and Denga, 1999). For
the protection and improvement of ecosystems, the framework aims to apply water
and sediment quality objectives to all Black Sea areas, whereas for human uses,
objectives would apply only to those areas that are (or intended to be) exploited for
such use. In this way, the proposed management framework considers the protection
96
and improvement of aquatic ecosystems as a separate issue to maintaining waters for
specific human uses.
The management framework has been developed on the basis of 5-point classification
schemes that define the quality of water required to provide ecosystem protection and
support specific human uses of different water bodies. To provide consistency with
European Union (EU) initiatives, each scheme is based on Environmental Quality
Standards (EQSs) and other regulatory values that have been derived either at the EU
level or national levels under the provisions of a relevant Directive.
In November 1998, the Advisory Committee on Pollution Monitoring produced a
draft of a sampling strategy for the Black Sea based on water use, which was
integrated into the EQO consultation document. An outline of the draft plan is
presented in Appendix B. Monitoring variables were included to determine the trend
in chemical (and trophic) status of the Black Sea ecosystem with respect to nutrients
(as shown by shaded areas in Appendix B), in accordance with statutory quality
objectives for estuaries and coastal waters described by Rees et al (1994). The
sampling strategy proposed by the Advisory Committee would however need to
readjusted in order to monitor the effectiveness of nutrient reduction measures by the
riparian countries. In particular, further inclusion of environmental status indicators
(especially with regard to biological indicators) would be required.
A regional marine AQC training scheme has been implemented by TACIS, which
should make current AQC procedures considerably better than those employed in the
past. However, the adoption of AQC procedures (both internal laboratory procedures
and participation in interlaboratory quality control schemes) is only one aspect of
producing reliable data. Standard Operating Procedures (SOPs) are also critical if the
monitoring data is to be considered truly trustworthy, with the same SOPs to be used
by all organisations involved in the monitoring. These are required for the adoption of
a single protocol for the selec tion of sampling sites, sampling procedures, the use of
preservatives (where required) and storage conditions/maximum length of time
between sample collection and analysis.
In such a complex environment as the Black Sea ecosystem, a single variable is
unlikely to explain the distribution and abundance of particular species. However,
temperature and salinity (as indicators of seasonal change) may exhibit strong
correlations with abundance of some benthic fauna, e.g. mysids (Williams and
Collins, 1984), some fish (Claridge and Potter, 1983), and many macroalgae.
Zooplankton have been shown in numerous studies to relate to a generalised salinity-
based classification in many marine environments (Williams 1984). Other factors are
also likely to be critical in de termining species presence and abundance, notably the
presence and concentrations of toxicants.
The following sections (2.5.1 to 2.5.7) provide a review of the potential trophic status
indicators that are available to monitor the extent of eutrophication in the Black Sea
over time. A summary of the indicators that are judged to provide the most relevant
information for the region are provided in Table 3.3. It must be stressed that a
baseline survey will be required (except in the case of chemical loads) in order to set
intermediate and long-term targets for each indicator in order to reflect an ecological
status similar to that observed during the 1997 and 1960s, respectively.
97
2.5.1 Chemical Loads to the Black Sea
Data should be requested on nutrient concentrations (total phosphorus [TP], soluble
reactive phosphorus [SRP], nitrite, nitrate, ammonium and Kjeldahl nitrogen)
concentrations and (where available) flow for the lowest freshwater monitoring point
on all rivers feeding into the Black Sea. All data held for these sites should be
requested with, where possible, flow data as daily means. Where nitrite, nitrate and
ammonium data are supplied, these determinands would be added together to
produce total inorganic nitrogen [TIN] concentrations. Samples should be collected
on a weekly basis. Advice on statistical analysis of these data is presented in
Appendix A.
Loads reported for 1997 that were transported by the Danube River were:
orthophosphate 16,000 tons (as P), total inorganic nitrogen, i.e. the sum of ammonia-
N, nitrite-N and nitrate-N, 300,400 tons (as N) (A. Cociasu, 1998, reported in Joint
Ad-hoc Technical Working Group ICPDR � ICPBS summary report, June 1999). The
actual target has yet to be finally agreed since it is established that an averaging over a
2.5 year time span either side of 1997 will provide a more realistic indication of
nutrient export.
2.5.2 Chemical Concentrations and Nutrient Cycling Within the Black Sea
2.5.2.1
Water Column
Bioavailable nutrients (SRP, TIN and BOD) should be monitored in the water column
at a minimum of 3 depths � in surface waters (1 m depth), some 20 m below the
pycnocline and in bottom waters (approximately 5-10 m above the sea bed). Sampling
should be undertaken at a range of sites, once per year only (during winter). Care
should be taken to ensure that bottom water samples are not contaminated with
sediment. Consideration should also be given to setting up permanent continuous
monitoring stations for dissolved oxygen and salinity within the Black Sea at a range
of depths.
2.5.2.2
Sediment
Bioavailable N and P should be monitored in interstitial water collected from surfacial
sediments in shallow waters and saltmarshes. Surface sediment should be sampled
and analysed for total organic carbon and BOD. Cores should also be collected from
shallow and deep water sediments, and monitored for sediment oxygen demand
(SOD). (Temperature must be recorded at the same time that samples are collected.)
Guidance on the measurement of SOD is presented by Nixon (1990).
Consideration should be given to developing and employing a monitoring
methodology for anoxic sediments. Likewise, consideration should be given to
monitoring mineralisation, nitrification (Reynolds et al., 1994) and denitrification
rates in sediment. These should be monitored on a seasonal (4 times per year) basis.
2.5.3 Physical Indicators � turbidity-related parameters
98
Depending upon the equipment used, turbidity is a measure of scattered light,
transmitted light or a combination of both (Hatton 1992, Kirk 1994 and Russel 1994).
Light transmission turbidimeters (also known as tranmissometers) are used in highly
turbid waters, not being well suited to the measurement of low turbidities, since this
requires the detection of a small change in a very large signal. The intensity of
transmitted light falls off exponentially with increasing suspended solids content of
the sample, the specific relationship depending on the concentration of the absorbing
species and its ability to absorb light of the frequency being used. Results are
expressed in Formazine Turbidity Units (FTU)1.
Scattered light turbidimeters provide a measure of the amount of light reflected by
suspended solids, rather than light absorption/transmission. This scattering of light is
measured at a chosen angle to the incident light - often 180�, 135�, 90�, 25� or
forward (0�). The intensity of the detected light is assumed to be directly proportional
to turbidity, with a zero signal at zero turbidity. Results from scattered light
turbidimeters are expressed in Nephelometric Turbidity Units (NTUs) 2.
Ratiometric turbidimeters measure both light transmission and light scattering. The
results from the two detectors are integrated, allowing compensation to be made for
variations in sample colour and light source intensity.
A further method of measuring turbidity is to use a Secchi disk. The disk is lowered
into the water until it can no longer be seen and the depth at which this occurs is
recorded. Other authorities measure the depth at which the disk reappears when it
brought closer to the surface and yet others take the mean of the
disappearance/reappearance depths as being the true measure of Secchi depth. Holmes
(1970) states that that the compensation depth is 2.0-3.5 Secchi depth.
The determination of suspended solids concentrations is often used as a surrogate for
turbidity monitoring (and vice versa). Suspended solids concentrations are determined
by separating the suspended solids from the water (by filtration - GF/C or cellulose
ester - or centrifugation) and drying. For routine analysis, drying is undertaken at
105�C, but for the determination of volatile matter and ash (not to be undertaken
using cellulose ester filters), the separated solids are subjected to a further period of
drying (30 min) at 500�C.
Optical methods for determining suspended solids are also available, and these are
discussed above in terms of turbidimeters. This is confusing, since it means that the
results from turbidimeters may be referred to as turbidity or suspended solids
(depending upon the calibration used), when there is a great deal of difference
between the two. Ratios of nephelometrically-determined turbidity measurements to
weighed suspended solids concentrations vary greatly depending on particle size, light
wavelength and instrument type.
The setting of turbidity-based water quality objectives is complicated by the high
degree of spatial and temporal variability, added to the fact that the assessment of
1 1 FTU = 1/400th of the turbidity of a stock formazine solution. This is made by adding 5.00 ml of
10% (w/v) hexamethylenetetramine and 5.00 ml of 1% (w/v) hydrazine sulphate solution to 90.00 ml
of distilled water.
2 1 FTU = 1 NTU measured on a formazine-calibrated 90� scatter instrument.
99
whether conservation interests have been damaged is largely a matter of subjective
judgement. For example, would an increase in turbidity leading to the loss of 5% of
the benthic area within the euphotic zone of a sampling transect constitute serious
ecological damage if community structure remained similar, with no loss of species
diversity?
It should be emphasised that turbidity is not the only method by which light
availability is reduced to benthic floral communities. Competition for light between
different species in such communities will als o be important. Thus, epiphytic algae
will be at a competitive advantage over those that require a rocky substrate for
anchorage. The role of epiphytes in reducing light availability to benthic macroalgae
and higher plants is extremely important, sometimes causing a greater reduction in
light availability to host plants than water column turbidity. Since the maximum depth
of colonisation is related both to turbidity and to epiphyte biomass, and epiphyte
biomass is related to nutrient status, it is a natural step to use the ratio of the
maximum depth of colonisation:Secchi depth as a trophic status indicator. For
example, for brown algae growing in a nutrient-poor environment, the ratio may be
between 3.0 and 3.5, but for the same taxa growing in nutrient -ric h waters, the ratio is
likely to be reduced, perhaps to 2.0-2.5.
It is important that the effects of changing turbidity levels are considered separately
for invertebrate and animal communities, even though the effects of gradually
increased sediment deposition rates may be long-term for both communities - for flora
in terms of light-limitation and for fauna in terms of changing sediment particle size.
Of the different methods of monitoring turbidity discussed above, Secchi disc is by far
the cheapest and simplest to monitor during calm weather, but can be difficult and the
results may be untrustworthy if monitoring when there is only a small swell.
Nevertheless, the results are widely understood. Secchi depth should be monitored
away from the turbidity plumes of inflowing rivers where turbidity due to
phytoplankton will not be overwhelmed by turbidity due to resuspended sediment.
Monitoring should be undertaken on a fortnightly or monthly basis (as for
chlorophyll-a analysis.
2.5.4 Biological Indicators � Microalgae
2.5.4.1
Productivity
Benthic microalgae may typically account for 20-25% of the primary productivity in
salt marshes (Kennish 1986, Adam 1990), but the reduced seasonality in microalgal
growth makes it distinct from other primary production. Thus, in temperate regions,
algal productivity may be the major component of marsh productivity during
autumn/winter (Zedler et al 1978, Pomeroy et al 1981).
Despite this, some seasonality is still present. For example, Sullivan and Daiber
(1975) found benthic algal productivity to be lowest in autumn/winter and highest in
spring. During summer, nutrient availability and shading by macrophytes may have
limited benthic algal productivity.
Peletier (1996) reported that in the Ems -Dollard Estuary, benthic chlorophyll-a levels
were high (>100 mg/m2) for much of the year, with no obvious spring or autumn
bloom when the sediments were organically enriched. However, since organic loading
100
to the estuary has decreased, benthic chlorophyll-a levels have fallen, with
pronounced peaks in benthic microalgal standing crops during spring and autumn.
This change in the standing crop and seasonality of microalgal standing crops was
attributed to increased abundance of macrofaunal diatom grazers (Nereis diversicolor
and Corophium volutator). N. diversicolor individuals have been estimated to
consume 5476-12,184 diatom cells/day while C. volutator individuals ate 2150-3767
diatom cells/day (Smith et al 1996).
Primary productivity measurements for epiphytic microalgae may also make a
substantial contribution to saltmarsh and coastal primary productivity. For example,
Marshall (1970) measured a value of 0.2 tonne C/ha/year, and Jones (1968) provided
a value for a marine grass (Florida) that was an order of magnitude higher. In the
latter case, the epiphytic macroalgae amounted to 20% of the macrophyte
productivity, a value that falls within the range of 18-50% cited by Kennish (1986) for
Zostera marina leaf and epiphyte production. For comparison, rates of microalgal
primary productivity in marine waters range from 0.05 to2.2 tonne C/ha/year
The values discussed so far illustrate just how important it is to differentiate between
standing crop and productivity. The standing crop (dry weight) of benthic microalgae
is usually negligible compared to the standing crop of vascular plants, but the
production cycles of the two groups of plants are what makes them both important in
production terms. While microalgae have a very short life span and rapid turnover, the
life span of macrophytes is usually very much longer and its turnover very much
slower. Breakdown of dead macrophytes may take years (e.g. Filip and Alberts 1989),
with Kirby (1989; cited in Walton 1994) reporting a Spartina root mass to persist for
nine years after treatment with herbicide. Decomposition of microalgae is probably
better measured in days or weeks.
Changes in microalgal (particularly phytoplankton) productivity have been widely
discussed as one of the major effects of eutrophication, but the fact remains tha t
growth rate/nutrient concentration plots demonstrate that only at very low nutrient
levels (e.g. <10 �g/l SRP) are nutrients actually limiting to algal growth. It remains a
paradox that although higher microalgal biomass (as measured by chlorophyll-a
content) is likely to be present at higher nutrient concentrations, maximum growth
rate (i.e. productivity) can be achieved at low levels. Light availability is more likely
to be a limiting factor to phytoplankton productivity than nutrient availability.
Measurement of microalgal primary productivity as an indicator of trophic status is,
therefore, not recommended.
2.5.4.2
Standing crop
When monitoring to investigate trends or abrupt changes in status, be it chemical or
ecological quality, it is necessary to minimise as many sources of variability as
possible. This means that the sampling/monitoring window should be narrowed on a
seasonal basis to record peak levels, or the sampling window must be wide enough
and sampling undertaken frequently enough to ensur e that a reasonable representation
of the mean value can be measured.
Phytoplankton have a typical doubling rate of 2-3 days under ideal growth conditions,
but typically have at least two periods when peak standing crops can occur � spring
and summer. More importantly, peak levels may easily occur a month apart during
successive years. This rapid rate of growth is reflected in the population dynamics -
101
minor blooms form and crash within a matter of weeks, so that weekly or twice-
weekly sampling is required if an estimation of peak levels is to be recorded.
Fortnightly or monthly sampling may miss blooms completely (Parr et al 1993).
Weekly sampling is labour intensive and expensive, so monitoring of peak algal
standing crop (chlorophyll-a) cannot be considered a realistic option. Twice weekly
sampling for chlorophyll-a analysis to calculate annual mean levels is therefore
recommended, but if this is too costly, monthly sampling may suffice, albeit that
wider confidence limits will be associated with the estimated annual mean value.
Sampling for chlorophyll-a analysis should be undertaken using an integrated sampler
� effectively a 5-metre long tube that is lowered vertically into the water column. The
uppermost end is sealed and the tube withdrawn from the water so that a 5-metre core
of water is sampled. This helps reduce variability associated with phytoplankton
stratification during calm weather, since flagellates are able to control their position
within the euphotic zone to some extent.
2.5.4.3
Community composition
Diatoms are probably best known (in an international context) for their use in
monitoring the pH status of freshwaters (e.g. Keithan et al 1988), notably as a
palaeolimnological technique for assessing historic water quality (e.g. Battarbe e and
Charles 1986, Duthie 1989, Jenkins et al 1990). However, at least as much attention
(if not more) has been paid to their use for assessing the organic carbon content of
waters (e.g. Watanabe 1986, Watanabe et al 1988, Prygiel and Coste 1993, 1996).
Much work has also been undertaken to relate indicator species to the nutrient
(phosphorus) status of waters (e.g. Keithan et al 1988; Niederhauser and Schanz
1993).
Within the last 15-20 years, the use of diatom communities to monitor freshwater
quality has been increasingly recognised. As with macroinvertebrate indices, a
number of methods have been suggested for calculating a result that can be related
either to a particular aspect of water quality, or for use as a broader-scale measure of
water quality. To date, the development of diatom indices for monitoring
environmental quality has concentrated on epilithic diatom communities (those
attached to stones), with palaeoecological benthic diatom studies focusing on lakes.
However, a growing number of diatom palaeoecological studies have also been
undertaken in marine waters, and a body of information has been built up concerning
the type of habitats favoured by a range of marine/estuarine diatom species.
Unlike freshwaters, however, very little work appears to have been undertaken on the
development of diatom indices in marine/estuarine habitats. Instead, work has focused
on benthic diatom indicator species. For example, Vos and de Wolf (1993) built up a
large database linking Baltic Sea diatom taxa to community type (planktonic,
episammic, epiphytic, etc.), salinity, pH, nutrient, temperature, tide and current
preferences.
It is clear that the development of an index or the identification of indicator species
should be undertaken only on a single community (one of the problems with river
epilithic diatom indices is that the epilithon consists of several communities or sub-
communities; see Round 1993). The estuarine/marine benthic diatom community
consists of three individual communities (according to Vos and de Wolf 1993), so it is
essential that development and identification work should concentrate only on one of
102
these communities. Of these, either the diatom community attached to sand grains or
the free-living community in interstitial water appears to be the best population to
target for the identification of Black Sea diatom indicator species and ultimately the
development of trophic status diatom index. The benthic diatom community
represents an ideal indicator of community, since the population lives close to the
very surface of the sediment, so is influenced by both water column and sediment
quality.
The benthic diatom community represents an ideal indicator of trophic status, albeit
only for shallow water sediments (those lying within the euphotic zone). It is strongly
recommended that that this community be sampled, individual taxa identified and the
sediment analysed for chemical and physical parameters (including nutrients, organic
carbon, salinity, toxicants, and particle size). The Vos and de W olf database should be
used as a guide to the storage of this information, and the Baltic Sea data should be
pooled with the Black Sea data in the development of a marine trophic diatom index.
2.5.5 Biological Indicators � Macroalgae and Higher Plants
2.5.5.1
Maximum depth of colonisation
Macroalgae can be used to monitor turbidity as an indicator of trophic status by
recording the maximum depth of colonisation of key species or genera. In addition,
the depth of macroalgal/macrophyte colonisation offers three major advantages over
convenional Secchi depth or suspended solids monitoring:
� It provides an integrated measure of turbidity over time - perhaps 6
months- 2 years.
� It provides a genuine measure of the depth of the euphotic zone, not
simply a measure of water clarity at a particular depth within the water
column.
� It is much more ecologically relevant.
Monitoring of colonisation depth requires SCUBA diving equipment, so both the
equipment itself and the training costs are likely to be high during years when
monitoring is carried out. However, since individual sites would require monitoring
only once every second or third years, the costs are not as great as may first be
thought, and the data gathered is amongst the best of all ecological indicators.
The maximum depth of macrophyte colonisation can also be used as indicator, since
this is thought to be subject to less temporal variability than macroalgal populations
(carbohydrate reserves stored in the roots of seagrasses enable the plants to survive
for extensive periods when light levels are below the compensation point). While
seagrasses are usually confined to discrete areas, making them unsuitable for
monitoring purposes at many sites, they also tend to form distinct colonies that start
and end quite abruptly. In contrast, the maximum depth of macroalgal growth can
103
vary considerably over short distances, so that the maximum depth of seaweed
colonisation may be more difficult to determine.
There are advantages to choosing an individual species as a bio-indicator, as Lumb
(1989) suggests with Laminaria digitata, since this will reduce any possible effect of
inter-species variability that may occur when a relatively large taxonomic group, such
as `brown algae', is chosen. However, since L. digita ta is replaced by other members
of the Laminariales at depth, the transition from one species to another may occur
over a depth of several metres, with the lower limit of L. digitata , in practice, being
difficult to determine at some sites. Until a comparison is made of the
species/genus/order approaches, however, it is not possible to say which method is
best. Of course, one of the aims of a macroalgal colonisation depth monitoring
programme could (and should) be to determine which is the best option by asking
divers to measure the depth of all three and comparing the results against Secchi depth
data at selected sites. The minimum light requirements for seagrasses and macroalgae
are shown in Table 2.1.
Table 2.1
Minimum light requirements of seagrasses and macroalgae (Masini et al 1995,
Lumb 1989, L�ning and Dring 1979)
PAR1 at Z (lower
PAR at Z(lower
Location
colonisation limit) (% of
colonisation limit) (%
PAR just below the of solar radiation
water surface)
above the water
surface)
Zostera marina
19.8
8.5
Northeast USA
(seagrass)
21.6
9.3
Denmark
Thalassia
25.7
11.0
Puerto Rica
testudinum
(seagrass)
Posidonia sinuosa
7.8- 13.7 depending 3.4- 5.9 depending Western Australia
(seagrass)
on epiphyte density on epiphyte
density
All seagrass specie s 15.6
6.7
Worldwide
Laminariales
0.7- 1.4%
Worldwide
(brown algae)
Foliose and/or
0.01-0.1%
0.05%
Worldwide
crustose coralline
red algae
1PAR -photosynthetically active radiation (approximately 400-700 nm wavelength). The range of light
energy capable of driving photosynthesis.
Whether using seagrasses or macroalgae, it is necessary to measure the depth of
colonisation from ordnance datum to either the sediment surface or to the holdfast
attaching the stipe to the rocky substrate. It will also be necessary to devise a simple
method for estimating the extent of epiphyte abundance.
104
To prevent the maximum depth of colonisation being recorded perhaps several
hundred metres apart on successive occasions, the position of monitoring sites should
be indicated with permanent buoys and shore markers. Borrowing from the Danish
National Marine Monitoring Programme, a line (transect) can then be run from the
shore marker to the appropriate buoy, along which the maximum depth of
colonisation is measured.
`Conventional' turbidity measurements would be a valuable addition to depth of
colonisation data, so whenever a depth of colonisation record is made, recorders
should be encouraged to monitor Secchi depth. Clearly, however, this cannot be
undertaken by shore-based divers, since a boat is required.
2.5.5.2
Biomass and productivity
Saltmarshes are considered to be amongst the most productive ecosystems in the
world (e.g. Howes et al 1986; Table 2.2), but estimates of productivity are usually
based on above-sur face standing crop measurements at the end of the growing
seasons. Biomass losses during the growing season are, therefore, not usually
accounted for.
Table 2.2
Productivity of marine/estuarine ecosystems (Carter 1988)
Ecosystem
Productivity
(tonne C.ha-1.yr-1)
Coastal waters
Oceanic waters
0.05-0.5
Upwelling zones
0.5-2.2
Shallow shelf
0.3-1.5
Coastal bays
0.5-1.2
Subtidal
Seaweeds
8-15
Coral reefs
17-25
Seagrasses
1.2-3.5
Intertidal
Seaweeds
1-2.5
Molluscs
0.1
Sandy beaches
0.1-0.3
Estuarine flats
5-7.5
Supra-tidal
Salt marshes (temperate)
7-13
Salt marshes (Arctic)
1-1.5
105
Sand dunes (fore)
4-5
Sand dunes (rear)
1.5-1.75
This is important since underground standing crops of are often much greater than the
above -surface standing crops (Valiela et al 1976, Long and Mason 1983, Agnew
1986), so cited values are often gross underestimates. For example between 50 and
90% of the biomass of Spartina alterniflora is estimated to be below ground (see
Kennish 1986). Moreover, such estimates are often based on the results of a small
number of quadrats, perhaps covering less than 1/100,000th or 1/1,000,000th of the
area of which the quadrat results are supposed to be representative. Storm damage
prior to biomass measurements can also greatly affect results, particularly for rocky
shore macroalgal communities. Bearing in mind the high degree of spatial
heterogeneity that may already be present in intertidal plant populations, this could
lead to false conclusions being drawn.
Growth of macroalgae and macrophytes is clearly seasonal, so it when monitoring
biomass and/or productivity it is necessary to reduce the sampling window to the
period when maximum standing crops are achieved (late summer). However, this fails
to address spatial variability. It is likely that the number of samples required to detect
a significantly significant change in biomass over, say, 5 years, would be far too high
and costly for a pragmatic macroalgal/macrophyte biomass sampling programme to
be undertaken.
In summary, the results of macrophyte and macrolalgal biomass density surveys
cannot be recommended as part of the proposed monitoring programme because of
the high degree of spatial variability and the short-medium term temporal variability
that may be caused by storm damage. Moreover, productivity data is likely to be
scientifically flawed.
2.5.5.3
Biochemical/physiological indicators
If macrophyte standing crop is too costly to measure robustly, is it possible to monitor
a biochemical/physiological indicator of macrophyte productivity instead? The
answer appears to be a qualified yes. Microalgae are renowned for accumulating
nutrients intracellularly during periods when extracellular nutrients are present at
concentrations greater than those required simply to fuel growth. However, `luxury
uptake' also occurs (albeit to a lesser extent) in macroalgae and in some higher plants,
such as Spartina spp and Zostera. It is possible that an increase in C:nutrient ratios
during early spring may res ult in greater productivity, but that growth through spring
and summer may deplete this internal nutrient store. Thus, by autumn, the C:N and
C:P ratios in Spartina growing in nutrient-rich and nutrient-poor sediments may show
little difference. The use of plant C:N:P ratios as an indicator of trophic status appears
promising, but is not yet well-enough understood to recommend as an indicator of
trophic status.
2.5.6 Invertebrates
Some meiofauna (notably nematodes) are generally tolerant of low dissolved oxygen
levels and organic enrichment (Sandull and de Nicola 1991), but other
macroinvertebrates are not. As such, benthic communities show marked taxonomic
changes in response to eutrophication.
106
The majority of available information for the Black Sea invertebrate community is for
the sediment infauna and this is the invertebrate community most often monitored in
relation to environmental change. The response of the macrobenthic communities to
organic enrichment is well documented (e.g. Edwards and Jack 1994) and a carefully
designed monitoring programme could detect changes in the degree of organic
enrichment using a number of standard measures. However, there would need to be
some established link between a change in nutrient status resulting in a greater
production of organic detritus for any change in macrobenthic community status to be
linked even indirectly to a change in nutrient (N and P) status.
While there is a very obvious link between organic and nutrient enrichment of coastal
waters, when large numbers of sampling sites are compared, within a single
waterbody the relationship is likely to be much weaker. Furthermore, any detection of
eutrophication impact on the infaunal community is likely to occur only after other
more sensitive (primary producer-based) indicators of change in nutrient status have
indicated change.
The use of the meiofauna in environmental monitoring is becoming more popular but
is still restricted to specialist organisations because the level of taxonomic skill
required is high. However, these animals have certain advantages over the
macrofauna, including a more rapid response time. It is also possible with nematode
taxa to divide them into functional or feeding groups. Some of these groups utilise
benthic diatoms as a prime food source. Thus, if a change in nutrient status was to
result in a change in the benthic diatom community or productivity, a secondary shift
in the nematode distribution in favour of these species could be linked to the change
in nutrient status.
The secondary productivity of benthos has been investigated in a similar manner to
primary productivity, with reviews presented, e.g. by Kennish (1986) and Warwick
(1980). Notable UK studies include work by Hughes (1970), Chambers and Milne
(1975), Warwick and Price (1975), Hibbert (1976) and Warwick et al (1978). For
individual species, values may exceed 1 tonne dry weight/ha in extreme cases, but an
overall total macrobenthic production rate of 0.3-0.6 tonne dry weight/ha appears to
be typical for many estuaries and coastal waters (Kennish 1986).
It is strongly recommended that the sediment infauna be used as an indicator of
trophic status, albeit for monitoring medium-long term recovery. However, for the
results to be used for this purpose it is essential that all organisations use the same
monitoring protocol. This includes:
� using the same type of grab when boat sampling;
� collecting the same sample size (area and depth) when shore sampling;
� using the same mesh size to filter the sample; and
� biological AQC procedures.
For the results to be fully understood, it will also be necessary to sample the sediment
at the same time as collecting the biota. The sediment should be analysed for toxicants
(organic and inorganic), particle size analysis and total organic carbon, in addition to
water column salinity. Such a monitoring programme is likely to be costly, but need
only be undertaken once every five years, using the surveys undertaken on the Mersey
Estuary (Codling 1990, Codling et al 1991a, 1991b) as the basis of a sampling
107
programme. Sampling sites should be selected well away from known point sources
of pollution (outfalls).
In terms of reporting, a variety of invertebrate indices are available, of which the
infaunal trophic index (ITI) appears to offer the greatest chance of success. This was
originally developed in the USA for monitoring organic pollution around marine
outfalls (REF), and has since been adapted for use in UK tidal waters. It is unlikely
that the index could be used in either it US or UK format without adaptation for the
environmental conditions in the Black Sea, and probably could not be used at all in
deeper waters because of the anoxic conditions. However, for marginal sediment
infaunal communities it may provide a valuable aid to reporting complex ecological
data in a simple, easily -understood manner.
2.5.7 Other Indicators
Compliance with water quality objectives is the most widely used indicator of water
quality, but such an approach is only valid when the WQOs are set at an appropriate
level. Similarly, temporal trends in nutrient concentrations is also a commonly-used
indicator. Likewise, compliance with consents (for municipal sewage treatment works
and industrial discharges) is a widely used indicator of water quality status,
particularly when those consents are derived taking WQOs into account. However,
such approaches are of limited use in terms of protecting the Black Sea, since they are
based on concentration, not loads, and consents/WQOs rarely include nutrient
parameters (except when conservation objectives have been set). In terms of
protecting the Black Sea, it is the nutrient load, not the nutrient concentration that
requires the greatest control.
On-farm nutrient balances have received much attention during the last decade, to the
extent that in some EU countries they are used as the basis of economic instruments to
prevent excessive nutrient pollution from agriculture (Parr et al 1999). The same
approach can be scaled up using national agricultural census statistics to determine
nutrient balances for agricultural production of whole countries. In such studies, the
input is represented by the N and P content of bought-in animal feed, inorganic
fertiliser usage and (in some studies) by atmospheric deposition of nitrogen. Output is
represented by the nutrient content of meat and harvested crops.
From nitrogen balance studies on agricultural land in the EU12 countries it has been
shown that the surplus (difference between input and output) varies from over 200 kg
N/ha/yr in the Netherlands to less than 10 kg N/ha/yr in Portugal (Figure 2.3). In
general, there is an increasing surplus with increasing inputs, reflecting increasing
potential leaching with increasing inputs. In terms of phosphorus balance studies,
calculations indicate that all EU12 countries are operating on a surplus, representing a
net annual accumulation of P in European agricultural soils (Brouwer et al 1995).
Agricultural nutrient balances for the proportions of those countries which drain into
the Black Sea would represent and excellent indicator of the success of an agricultural
nutrient control programme. However, such balances must be based on trustworthy
information, including that gathered from fertiliser sales statistics, crop production
figures and typical crop nutrient content data. This information is not considered
likely to be accurate enough at present.
108
700.00
kg/ha/year
600.00
500.00
400.00
Input (kg/ha/year)
Output (kg/ha/year)
300.00
200.00
100.00
-
Italy
UK
Spain
Belgium
France
Denmark
Greece
Ireland
Germany
Portugal
Netherlands
Luxembourg
Figure 2.3
Nitrogen balances for agricultural land in EU12 countries (1993) (Crouzet et al
1999)
109
2.6 Summary of Recommended Trophic Status Monitoring
Programme
A summary of the recommended trophic status indicators is given in Table 2.3.
Table 2.3
Recommended trophic status indicators for the Black Sea
Indicator
Sampling frequency
Comments
Chemical Loads :
Weekly concentration
Data analysis discussed
TP, SRP, nitrite, nitrate,
data; continuous flow
in appendix A.
ammonium (DIN]),
measurement reported
Confidence limits must
Kjeldahl nitrogen, BOD,
as daily mean flows.
be calculated.
total organic carbon and
COD.
Nutrient concentrations:
Consider developing
Water column - SRP, TIN and
Once per year at 3 depths. methodology for anoxic
BOD.
sediments. Consider
Sediment � Bioavailable N and P,
Once per year.
monitoring mineralisation,
total organic carbon, BOD
nitrification and
and SOD.
denitrification rates in
sediment on a seasonal basis
(4 times per year).
Physical indicators:
Once every two weeks or
Monitor away from the
Secchi depth.
once per month
turbidity plumes of
depending on monitoring inflowing rivers. Shallow
budget.
water monitoring sites
should coincide with
maximum depth of
macroalgal/ macrophyte
colonisation monitoring
sites.
Microalgae:
Once every two weeks or
Collect sample using a 5-m
Standing crop (chlorophyll- once per month
integrated sampler. Sample
a).
depending on monitoring wherever Secchi depth is
budget.
recorded.
Community composition
The Vos and de Wolf (1993)
(benthic diatom
Twice per year.
Baltic Sea data should be
community).
pooled with Black Sea data
in the development of a
marine trophic diatom
index.
Also monitor sediments for
nutrients, organic carbon,
pH, salinity, toxicants, and
particle size).
110
Table 2.3
Continued...
Indicator
Sampling frequency
Comments
Macroalgae and higher
Once every second or
Also record Secchi depth
plants:
third year (during
and chlorophyll-a at these
Maximum depth of
summer) depending on
monitoring sites.
colonisation
monitoring budget
Use results to determine
whether species, genus or
order approach is the best
option for longer-term
monitoring.
Invertebrates:
Major survey every 5
To be used for monitoring
Sediment infauna
years
medium-long term (>5
years) recovery of the Black
Sea.
Sampling sites should be
selected well away from
known point sources of
pollution.
The sediment should also
be analysed for toxicants
(organic and inorganic),
particle size analysis and
total organic carbon, in
addition to water column
salinity.
As to habitats for environmental monitoring, according to Zaitsev (personnel
communication) hotspots need to be in the centre of attention, as areas rich in total
numbers of species or/and areas of especially high man-made impact (Norse, 1993).
The following information was kindly provided by Professor Zaitsev:
In the Black Sea the most important hotspots are following habitats.
In the bottom realm :
� The Phyllophora field in the central part of the north-western shelf. It is a
large aggregation of red agar -bearing algae of the Phyllophora genus.
Phyllophora is a nucleus of a bio-community known as the Phyllophora
biocoenosis, which included up to 120 species of invertebrates and 50 species
of fish (Vinogradov, 1967). As a result of turbidity related environmental
parameters, the stocks of Phyllophora sharply decreased. In the 1950s, the
area occupied by Phyllophora was 10,000 km2, with a total biomass of about
10,000,000 t. Toward 1980s, this area had diminished to 3,000 km2 and
biomass had declined to 1,000,000 t. In 1990 these values had declined even
further to 500 km2 and 500,000 t respectively. At the same time another small
Phyllophora field, situated at 10-15 m depth on the same shelf continued its
normal development (Zaitsev, 1992).
111
� Seasonal hypoxic zones at 10-30 m depth in front of largest rivers- Danube,
Dniester and Dnieper, where in summer-autumn seasons mass mortalities of
bottom-living invertebrates and fish occurs (Zaitsev, 1993). A drastic fall in
benthic animals stocks, including commercial species like the blue mussel
Mytilus galloprovincialis occurs. The biological losses due to hypoxia on the
north-western shelf are estimated at 100 to 200 t per square kilometre of
seabed.
� Rocky shores, inhabited by the brown alga Cystoseira barbata , a nucleus of
the Cystoseira biocoenosis, which included up to 70 species of epiphyte algae,
invertebrates and fish. Cystoseira is very sensitive to eutrophication and has
virtually disappeared in impacted shore zones, where was replaced by
filamentous algae (Minicheva, 1990, Zaitsev&Mamaev, 1997). Cystoseira
began disappearing along NW shores in Romania and Ukraine in the 1980s
(Petranu, 1997, Zaitsev&Alexandrov, 1998).
� Sandy beaches, inhabited by dozen of species of psammobiontic organisms.
The most sensitive of them to the siltation by organic particles (one of
consequences of eutrophication) in the supralittoral zone are the worm
Ophelia bicornis (Polychaeta) and the bivalve Donacilla cornea. At 5-10 m
depth, very sensitive to eutrophication are the hermit crab Diogenes pugilator
and the ghost shrimps Upogebia pusilla and Callianassa pestai. These species
practically have been disappeared on the north-western shelf since the 1970s,
but after the middle 1990s their populations are gently increasing (Zaitsev,
1998).
In the pelagic realm:
The ecotone between fresh and marine waters. This narrow transitional zone of 1-5 m
wide is clearly visible in front of the river water plumes owing to concentration of
foam, fragments of algae, leafs of Zostera and different kind of flotsam. This is a
convergence zone, in which surface marine and river waters come together and where
large amounts of surface-living organisms, both of marine and fresh-water origin
occurs. This ecotone is especially rich in blue-green neustonic copepods Pontella
mediterranea and Anomalocera patersoni, isopod Idothea stephenseni, zoea and
megalops of shrimps and crabs, fry of gray mullets Mugil cephalus, Liza saliens, L.
aurata, red mullet Mullus barbatus ponticus, garfish Belone belone euxini and
dragonets Callionymus belenus and C. festivus. In the 1960s, in one metre of the
Danube river ecotone, which was at 8 nautical miles from the shore, were catched up
to 60,000 pontellid copepods, 25 zoea and megalops, 18 Idothea stephenseni and 30
gray mullet fry (Zaitsev, 1971). In the 1980s, only 5-10 pontellids, 1-2 larvae of
decapods, 1-2 isopods and 2-3 fry of gray mullets in the same area were observed.
Instead of them, huge amounts of Noctiluca scintillans were detected (Zaitsev et al.,
1988). In the late 1990s, a gentle rehabilitation of this were specific habitat is
observed.
The open coastal (neritic) waters. In eutrophication conditions (Zaitsev, 1998) these
waters are inhabited mostly by dinoflagellates (e.g. Exuviaella cordata, Noctiluca
scintillans), infusorians (e.g. Mesodinium rubrum, which is able to give a red colour
to the sea surface during its vertical migrations at noon), small crustaceans (e.g.
Podon polyphemoides), the scyphozoan
Aurelia aurita. The ratio
Dinoflagellates/Diatoms is a rather good biological indicator of eutrophication levels:
in the 1960s, the Dinoflagellate cell numbers was 15-20% of the total, whereas in the
112
1980s it reached up 35-45% (Ivanov, 1967, Nesterova, 1987). A very characteristic
consequence of the Black Sea eutrophication for phytoplankton is the increase in
numbers of "mass species" (i.e. those exhibiting concentrations of more than 100,000
cells.l-1. According to Bodeanu (1987-1988), there were 16 mass species in 1960-
1970. This increased to 22 in 1971-1982, and in 1983-1988 to 54 species. Since the
1970s, large phytoplankton blooms became ordinary events in Ukrainian, Romanian
and Bulgarian coastal waters (Mihnea, 1984, Konsulov, 1998, Petranu, 1997,
Zaitsev&Alexandrov, 1998).
In coastal wetlands:
Brackish-water limans (e.g. Razelm-Sinoe complex in Romania, and Dniester and
Dnieper rivers limans in Ukraine) are inhabited mostly by pontian relics. There are
polychaetes Hypania invalida and Hypaniola kowalewskii, bivalves Dreissena
polymorpha, Hypanis relicta, Hypanis colorata , crustaceans Pontogammarus
maeoticus and Paramysis pontica, fish as Clupeonella delicatula , sturgeons, herings
(Wilson&Moser, 1994, Zaitsev&Mamaev, 1997). In eutrophication conditions,
bottom hypoxic zones in these areas appeared. (Marinov et al., 1984,
Zaitsev&Mamaev, 1997).
Salt-water limans and lagoons, inhabited mostly by mediterranean origin species.
Some of such water bodies are sites of traditional gray mullets culture (Konsulov,
1998, Petranu, 1997, Zaitsev&Alexandrov, 1998). The main food of these fish are
benthic microalgae and meiobenthic animals, which are strongly influenced by the
eutrophication syndrome (Gomoiu, 1985, Guslyakov et al., 1992, Vorobyova et al.,
1992).
Although the cause of eutrophication (increased availability of nutrients) is easily
understood, the biological responses and interactions, in addition to changes that
occur in nutrient cycling pathways, are very complex. For this reason it is necessary to
monitor a range of indicators (chemical, physical and biological) in order to robustly
assess the extent of eutrophication and any change in trophic status.
While 1997 has been chosen as the baseline date for chemical concentration/nutrient
load monitoring, it will not be possible to use this date as the baseline for other
indicators, since appropriate monitoring data were not collected at that time. This is
almost certainly true with regard to macroalgae/higher plants, sediment chemistry and
the composition of sediment infaunal and benthic diatom communities. Moreover,
nutrient concentrations vary within the Sea itself on both a temporal (seasonal) and
spatial basis; so unless the same sampling times and sites are used as in 1997, the
results may not be suitable for comparison with data from the programme outlined
above.
While it is recommended that chemical load data (possibly in addition to chlorophyll-
a, chemical concentration and Secchi depth data) collected as part of the
recommended monitoring programme (Table 2.3) are used with historical data as part
of a trend analysis, other data will need to be treated differently. Thus,
macroalgae/higher plant, diatom community, sediment infaunal community and
sediment chemistry monitoring data collected during the first years sampling should
be used as the baseline for analysis by comparison (sediment invertebrate data) or as
part of a 5-year trend analysis with data collected in later years.
113
Bearing in mind the very long retention time of the Black Sea, it is not expected that
major (or possibly even significant) changes in trophic status will be observed within
5 years of Nutrient Action Plans (NAPs) being implemented in riparian countries.
Land in a further 11 countries drains into the Black Sea, and nutrient export from this
land will also need to be addressed. Five years is therefore a very short time-scale
over which to judge the effect of the NAPs, especially when it is realised that any
legislative changes required as part of the NAPs could take 5 years to achieve.
Improvements in trophic status are likely to be observed first in shallow marginal
waters. It is, therefore, hoped that in subsequent years funds will be made available to
continue monitoring beyond the initial 5-year period.
To monitor progress of the 5-year nutrient reduction plans will require only the
chemical load monitoring data, since the action plans are written with the specific aim
of reducing nutrient loading to the Black Sea; the reduction in trophic status is an
expected benefit of this. However, to know whether the nutrient action plans have had
the desired effect of lowering the trophic status of the Black Sea, it will be necessary
to monitor all of the recomm ended indicators.
Because of the reasons laid out above, and the fact that sampling sites have not yet
been chosen, it is not possible to provide targets for the monitoring programme; only
to recommend that trend analysis is undertaken on the data collected.
114
References for Sections 1 and 2
Adam, P. (1990) Saltmarsh Ecology. Cambridge University Press, Cambridge.
Agnew, A.D.Q. (1986) The salt marsh. In: Ynyslas Nature Reserve Handb ook.
Part 4: The Estuary, pp. 160-167. Nature Conservancy Council.
Battarbee, R.W. and Charles, D.F. (1986) pH reconstruction studies of acid
lakes in Europe and North America: a synthesis, Water, Air and Soil
Pollution , 30, 347-354.
Bodeanu, N., (1987) Structure et dynamique de l'algoflore unicellulaire dans les
eaux du littoral roumain de la Mer Noire. Cercetari marine, Constanta, 20/21: 19-250
(in French).
Borum, J. (1996) Shallow waters and land/sea boundaries. In: B.B. Jorgensen
and K. Richardson (eds.) Eutrophication in Coastal Marine Ecosystems. pp.
179- 203. American Geophysical Union. Washington, DC.
Brouwer, F.M., Goeschalk, F.E., Hellegers, P.J. and Kelholt, H.J. (1995)
Mineral balances at the farm level in the European Union. Agricultural
Economics Institute, The Hague.
Burt, J.S., Masini, R.J. and Simpson, C.J. (1995a) Light and Posidonia
sinuosa seagrass meadows in the temperate coastal waters of western
Australia. I. Factors influencing water column light attenuation. Department
of Environmental Protection, Perth, Western Australia 6000.
Burt, J.S., Kendrick, G.A., Masini, R.J. and Simpson, C.J. (1995b) Light and
Posidonia sinuosa seagrass meadows in the temperate coastal waters of
western Australia. II. Effect of epiphyte species assemblage and biomass on
attenuating light to the leaf surface. Department of Environmental Protection,
Perth, Western Australia 6000.
Carter, R.W.G. (1988) Coastal Environments. Academic Press, London.
Chambers, M.R. and Milne, H (1975) The production of Macoma balthica (L.)
in the Ythan Estuary, Estuarine, Coastal and Marin e Science, 3, 443.
Claridge, P.N. and Potter, I.C. (1983) Movements, abundance, age
composition and growth of bass Dicentrarchus labrax in the Severn Estuary
and inner Bristol Channel, UK, Journal of the Marine Biological Association
UK, 63 , 871-880.
Codling, I.D. (1990) Biological assessment of the Mersey Estuary, Journal of
the Marine Biological Association UK, 70, 670- 671.
Codling, I.D., Nixon, S.C., Ashley, S.J., Butler, R., Flower, T. and Horn, K.
(1991a) Biological assessment of the water quality of the Mersey Estuary -
final report. WRc report No. CO 2770-M.
115
Codling, I.D., Nixon, S.C. and Platt, H.M. (1991b) The Mersey Estuary. An
assessment of the biological status of intertidal sediments. WRc report No NR
2757.
Crouzet, P., Leonard, J., Laf fon, L., Nixon, S.C., Rees, Y., Parr, W., B�gestrand, J.,
Kristensen, P., Lallana, C., Izzo, G., Bokn, T. and Bak, K. (1998) Excessive
anthropogenic nutrients in European ecosystems. Draft report to the European
Environment Agency. ETC/IW Report No. PO24/97/1.
Duthie, H.C. (1989) Diatom -inferred pH history of Kejimkujic Lake, Nova Scotia: a
reinterpretation, Water, Air and Soil Pollution , 46,317-322.
Edwards, A. and Jack, I.A. (1994) Forecasting the deposition and biological effects of
excess organic carbon from sewage discharges: a review of the literature. Report to
SNIFFER No. SR 6002.
Ellis, J.C., van Dijk, P.A.H. and Kinley, R.D. (1993) Codes of practice for
data handling - version 1. NRA R&D Note 241.
Filip, Z. and Alberts, J.J. (1989) Humic substances isolated from Spartina
alterniflora (Loisel.) following long-term decomposition in sea water, Science
of the Total Environment, 83, 273-285.
Gomoiu, M.-T. (1985). Problemes comcernant l'eutrophisation marine. Cercetari
marine, Constanta, 18: 59-95 (in French).
Gowen, R.J., Tett, P. and Jones, K.J. (1992) Predicting marine eutrophication:
the yield of chlorophyll from nitrogen in Scottish coastal waters, Marine
Ecology Progress Series, 85, 153-161.
Gunby, A., Nixon, S.C. and Wheeler, M.A. (1995) Development and testing of
General Quality Assessment schemes: nutrients in estuaries and coastal waters.
National Rivers Authority Project Record 469/16/HO.
Guslyakov, N.E., Zakordonets, O.A. and Gerasimyuk V.P. (19920 Atlas of benthic
Diatoms of the North-Western Black Sea and adjacent waters. Kiev: Nakova Dumka
Publ. 112 p. (in Russian).
Hatton, E. (1992) Review of turbidity. National Rivers Authority R&D Note
91.
Holmes, R.W. (1970) The Secchi disk in turbid coastal waters, Limnology and
Oceanography, 15 , 688-694.
Hibbert, C.J. (1976) Biomass and production of a bivalve community of an
intertidal mudflat, Journal of Experimental Marine Biology and Ecology, 25 ,
249.
Howes, B.L., Dacey, J.W.H. and Goehringer, D.D. (1986) Factors controlling
the growth form of Spartina alterniflora; feedbacks between above -ground
116
production, sediment oxidation, nitrogen and salinity, Journal of Ecology, 74 ,
881- 98.
Hughes, R.N. (1970) An energy budget for a tidal flat population of the
bivalve Scrobicularia plana (da Costa), Journal of Animal Ecology, 39 , 357.
ISSG (1990) The Irish Sea: An Environmental Review. Part Two: Waste
Inputs and Pollution. Published for the Irish Sea Study Group by Liverpool
University Press.
Ivanov, A.I. 1967. Phytoplankton. Biology of the north-western part of the Black Sea,
Kiev: Naukova Dumka Publ., pp. 59-75 (in Russian).
Konsulov, A. (comp.) 1998. Black Sea Biological Diversity. Bulgaria. New York:
United Nations Publications, 131 p. (in English).
Jeffrey, D.W., Madden, B., Rafferty, B., Dwyer, R. and Wilson, J.G. (1991)
Indicator organisms as a guide to estuarine management. In: D.W. Jeffrey and
B. Madden (eds) Bioindicators and Environmental Management, Academic
Press, pp 55-64.
Jeffrey, D.W., Brenan, M.T., Jennings, E., Madden, B. and Wilson, J.G.
(1995) Nutrient sources for in-shore nuisance macroalgae - the Dublin Bay
case study, Ophelia , 42 , 147-161.
Jenkins, A., Whitehead, P.G., Cosby, P.J. and Birks, H.J.B. (1990) Modelling
long-term acidification: a comparison with diatom reconstructions and the
implications for reversibility, Philosophical Transactions of the Royal Society
of London , Series B, 327, 435-440.
Joint Ad-hoc Technical Working Group ICPDR� ICPBS (June 1999) Causes
and effects of eutrophication in the Black Sea � Summary report.
Jones, J.A. (1968) Primary productivity by the tropical marine turtle grass
Thalassia testudinum K�nig, and its epiphytes. PhD thesis, University of
Miami.
Keithan, E.D., Lowe, R.L and DeYoe, H.R. (1988) Benthic diatom
distribution in a Pennsylvania stream: role of pH and nutrients, Journal of
Phycology, 24 , 581-585.
Kennish M.J. (1986). Ecology of Estuaries. Vol 1. Physical and Chemical
Aspects. CRC Press.
Kirk, J.T.O. (1994) Light and Photosynthesis in Aquatic Ecosystems. Second
Edition. Cambridge University Press.
Koerselman, W. and Meuleman, A.F.M. (1996) The vegetation N:P ratio: a
new tool to detect the nature of nutrient limitation, Journal of Applied
Ecology, 33 , 1441-1450.
Long, S.P. and Mason, C.F. (1983) Saltmarsh Ecology, Blackie, Glasgow.
117
Lumb, C.M. (1989) Algal depth distribution as an indicator of long-term
turbidity change. In: M. Elliott and J. McManus (eds) Developments in
Estuarine and Coastal Study Techniques, pp. 69-74. Olsen & Olsen,
Fredensborg, Denmark.
L�ning, K. and Dring, M.J. (1979) Continuous underwater light measurement
near Helgoland (North Sea) and its significance for characteristic light limits
in the sublittoral region, Helgol�nder Wess. Meeresunters, 32 , 403-424.
Mainstone, C.P., Parr, W. and Day, M. (2000) Phosphorus in Rivers: tackling
sewage treatment (in press)
Marinov, T., Petrova-Karadshova, V.I and Konsoulov, A. 1984. Recent state and
trends in hydrobiological researches in the Black Sea. Izvestia na Instit. po rybny
resursy. Varna, 43: 17-23 (in Bulgarian).
Marshall, N (1970) Food transfer through the lower trophic levels of the
benthic environment. In: J.H. Steele (ed), Marine food chains, 52. Oliver and
Boyd, Edinburgh.
Martin, J.H., Coale, K.H., Johnson, K.S. e t a l (1994) Testing of the iron
hypothesis in ecosystems of the equatorial Pacific Ocean, Nature, 371, 123-
129.
Masini, R.J., Burt, J.S. and Simpson, C.J. (1995) Light and Posidonia sinuosa
seagrass meadows in the temperate coastal waters of western Australia. III.
Minimum Light requirements. Department of Environmental Protection,
Perth, Western Australia 6000.
McCauley, E., Downing, J.A. and Watson, S. (1989) Sigmoid relationship
between nutrients and chlorophyll-a among lakes, Canadian Journal of
Fisheries and Aquatic Sciences, 1171-1175.
Mee, L.D. (1999) How to save the Black Sea. Your Guide to the Black Sea
Strategic Action Plan. The Black Sea Environmental Programme, Black Sea
Project Implementation Unit, Hareket Kosku II, Dolmabahce Sarayi, Besiktas,
80680, Istanbul, Turkey.
McCauley, E., Downing, J.A. and Watson, S. (1989) Sigmoid relationship
between nutrients and chlorophyll-a among lakes, Canadian Journal of
Fisheries and Aquatic Sciences, 1171-1175.
Mihnea, P.E., 1984. Phytoplankton indicator species -effect of pollution on
phytoplankton species. Rapp. Comm. Int. Mer. Medit., 29, 9: 85-88.
Minicheva, G.G., 1990. The prediction of phytobenthos structure with the help of
specific surface indices of algae. Botan zhurn., 75, 11, pp. 1611-1618 (in Russian).
Moss, B, Madgwick, J. a nd Phillips, G. (1996) A guide to the restoration of
nutrient-enriched shallow lakes. The Broads Authority, 18 Colegate, Norwich,
Norfolk NR3 1BQ, UK.
118
Nesterova, D.A.,1987. Features of phytoplankton successions in the north-western
part of the Black Sea. Hydrobiological Journ., 23: 16-21 (in Russian).
Niederhauser, P. and Schanz, F. (1993) Effects of nutrient (N, P, C)
enrichment upon the littoral diatom community of an oligotrophic high-
mountain lake, Hydrobiologia , 269/270 , 447- 452.
Nixon, S.C. (1990) Oxygen balance in estuaries. WRc report No PRS 2462-M.
Norse, E.A. (Ed). 1993. Global marine biological diversity. A strategy for building
conservation into decision making. Washington D.C.: Island Press, 383 pp.
OECD (1982) Eutrophication of Waters: Mo nitoring, Assessment and
Control. Report of the OECD cooperative programme on eutrophication,
edited by R.A. Vollenweider and J. Kerekes. Organisation for Economic
Development and Cooperation, Paris.
Parr, W. (1992a) Possible replacements for the biochemical oxygen demand
(BOD(5)) test and suspended solids as measures of effluent and water quality.
WRc report No. NR 3210/3213.
Parr, W. (1992b) Manipulation of fish communities to control algal levels in
reservoirs. Foundation for Water Research report No. FR 0300.
Parr, W. (1993) Biological control of blue-green algal levels in reservoirs: the
utility of silver carp. Foundation for Water Research report No. FR 0365.
Parr, W. (1993) Algal bioassays: a review of their potential for monitoring
and managing the trophic status of natural waters. WRc Report No SR 3439/1.
Parr, W., Nixon, S.C., Ashley, S. and Woodrow, D. (1993) Classification
options for trophic status. WRc report No NR 3402/1/7075. NRA R&D note
248.
Parr, W., Nixon, S.C. and Wheeler, M.A. (1995) Review of water quality
objectives for algal growth potential. Hydraulics and Water Research (Asia)
Ltd report No. HWR 130 to Hong Kong Government, Environmental
Protection Division.
Parr, W. and Wheeler, M.A. (1996) Trends in nutrient enrichment of sensitive
marine areas in England. WRc report No. CO 4055.
Parr, W., Clarke, S.J., van Dijk, P. and Morgan, N. (1997) Turbidity in
English and Welsh Tidal Waters. WRc Report No. CO 4301.
Parr, W., Wheeler, M.A. and Codling, I. (1999) The Glaslyn/Dwyryd,
Mawddach and Dyfi estuaries: nutrient status, nutrient budgets and ecological
importance. WRc report No. CO 4704.
Parr, W., Andrews, K., Mainstone, C.P. and Clarke, S.J. (1999) Diffuse pollution:
sources of N and P. WRc report No. DETR 4755 to DETR.
119
Peletier, H. (1996) Long-term changes in intertidal estuarine diatom
assemblages related to reduced input of organic waste, Marine Ecology -
Progress Series, 137 , 265-271.
Petranu, A. (Comp.), 1997. Black Sea Biological Diversity. Romania. New York:
United Nations Publications, 314 pp
Pomeroy, L.R., Darley, W.M., Dunn, E.L., Gallagher, J.L., Haines, E.B. and
Whitney, D.M. (1981) Primary production. In: L.R. Pomeroy and R.G.
Wiegert (eds), The Ecology of Salt Marsh , 39-67. Springer-Verlag, New York.
Prairie, Y.T., Duarte, C.M. and Kalff, J. (1989) Unifying nutrient-
chlorophyll-a relationships in Lakes, Canadian Journal of Fisheries and
Aquatic Sciences, 1176-1182.
Prieur, L. and Sathyendranath, S. (1981) An optical classification of coastal
and oceanic waters based on the specific spectral absorbance curves of
phytoplankton pigments, dissolved organic matter, and other particulate
materials, Limnology and Oceanography, 26, 671- 689.
Prygiel, J. and Coste, M. (1996) Diatoms and diatom indices in the networks
for quality measurement of French watercourses - short history and future,
Bulletin Francais de la Peche et de la Pisciculture, 341/42, 65-79.
Rees, Y.J., Nixon, S.C., Parr, W. and van Dijk, P. (1994) Nutrient levels and
statutory quality objectives for estuaries and coastal waters. WRc report No
NR 3055/1/4277. NRA R&D Note 70.
Rekolainen, S. (1989) Phosphorus and nitrogen load from forest and
agricultural areas in Finland, Aqua Fennica , 19, 95-107.
Reynolds P.J. (1997) An Assessment of the A.I.S.E. Code of Good
Environmental Practice for Household Laundry Detergents. Final Report to
the European Commission (DGIII), EC 10735, October.
Reynolds, P.J., Bealing, D.J., Sidorowicz, S.V. and Watson, S.J. (1994) Nitrification
rates in rivers and estuaries. NRA R &D Note 346.
Reynolds, P.J and Denga, Y (1999) Environmental Quality Objectives for the
Black Sea Ecosystem. Final report prepared for TACIS, Project No.
ENVRUS9602.
Round, F.E. (1993) A review and methods for the use of epilithic diatoms for
detecting and monitoring changes in river water quality 1993. Methods for the
examination of waters and associated materials. HMSO.
Russell, S. (1994a) Turbidity: a guide to measurement in water applications.
WRc Instrument handbooks. WRc plc, Swindon.
120
Sand-Jensen, K., Nielsen, S.L., Borum, J. and Geertz, O. (1994) Fytoplankton
ogmakrofyt udvikling I danske kystomr�der. Havforskning fra milj�styrelsen
No. 30.
Sandull, R. and de Nicola, M. (1991) Responses of meiobenthic communities
along a gradient of sewage pollution, Marine Pollution Bulletin , 22, 463-467.
Sas, H. (1989) Lake restoration by reduction of nutrient loading. Academia Verlag.
Scott, C.R., Hemingway, K.L., Elliott, M., de Jonge, V.N., Pethick, J.S.,
Malcolm, S. and Wilkinson, M. (1997) Impact of nutrients in estuaries - Phase
2 (edited by M. Ellliott). Environment Agency Project Record.
Smith, D., Hughes, R.G. and Cox, E.J. (1996) Predation of epipelic diatoms
by the amphipod Corophium volutator and the polychaete Nereis diversicolor ,
Marine Ecology Progress Series , 145 , 53-61.
Sprent, J.I. (1987) The Ecology of the Nitrogen Cycle . Cambridge University
Press.
Sullivan, M.J. and Daiber, F.C. (1975) Light, nitrogen and phosphorus
limitation of edaphic algae in a Delaware salt marsh, Journal of Experim ental
Marine Biology and Ecology, 18 , 79-88.
Valiela, I, Teal, J.M. and Persson, N.Y. (1976) Production and dynamics of
experimentally enriched salt marsh vegetation: below ground biomass,
Limnology and Oceanography , 21, 245-252.
Vinogradov, K.A. (Ed.), 1967. Biology of the north-western part of the Black Sea,
Kiev: Naukova Dumka Publ., 268 pp. (in Russian).
Vorobyova, L.V., Zaitsev, Yu.P., Kulakova, I.I., 1992. Interstitial meiofauna of the
Black Sea sandy beaches. Kiev: Naukova Dumka Publ., 142 pp. (in Russian).
Vos, P.C. and de Wolf, H. (1993) Diatoms as a tool for reconstructing
sedimentary environments in coastal wetlands; methodological aspects,
Hydrobiologia , 269/270 , 285-296.
Walton, S. (1994) Control of Spartina anglica on the Mawddach Estuary,
Wales. MSc thesis, University College of North Wales, Bangor.
Watanabe, T. (1986) Saprophilous and eurysaprobic diatom taxa to organic
water pollution and diatom assemblage index (DAIpo), Diatom, 2, 23-73.
Watanabe, T., Asai, K. and Houki, A. (1988) Numerical estimation to organic
pollution of flowing water by using the epilithic diatom assemblage - diatom
assemblage index (DAIpo), Science of the Total Environment, 55, 209-218.
Warwick, R.M. (1980) In: Tenore, K.R. and Coull, B.C. (eds) Marine Benthic
Dynamics. University of South Carolina Press, Columbia.
121
Warwick, R.M. and Price, R. (1975) Macrofaunal production in an estuarine
mudflat, Journal of the Marine Biological Association UK, 55 , 1-18.
Warwick, R.M., George, CL. and Davies, J.R. (1978) Annual macrofauna
production in a Venus community, Estuarine, Coastal and Marine Science , 7 ,
215.
Wells, M.L., Zorkin, N.G., and Lewis, A.G. (1983) The role of colloid
chemistry in providing a source of iron to phytoplankton, Journal of Marine
Research, 41, 731.
Williams, R. (1984) Zooplankton of the Bristol Channel and Severn Estuary,
Marine Pollution Bulletin , 15, 66-70.
Williams, R. and Collins, N.R. (1984) Distribution and variability in
abundance of Schistomysis spiritus crustacea mysidacea in the Bristol
Channel, UK, in relation to environmental variables, with comments on other
mysids, Marine Biology (Berlin), 80, 197-206.
Wilson, A.M. and Moser, M.E., 1994. Conservation of Black Sea wetlands: a review
and preliminary action plan. IWRB Publ. 33, 76 pp. (in English).
Wyatt, R.J., Ellis, J.C., Milne, I. and Gunby, J.A. (1998) Improved environmental
monitoring: manual of best practice for the design of water quality monitoring
programmes. Environment Agency R&D Technical Report E59.
Zaitsev, Yu.P., (1971). Marine Neustonology. Jerusalem: Israel Program for Scientific
Translations, 207 pp.
Zaitsev, Yu.P., (1992) Recent changes in the trophic structure of the Black Sea.
Fisheries Oceanography, 1, 2, 180-189
Zaitsev, Yu.P., (19930. Impacts of eutrophication on the Black Sea fauna. General
Fisheries Council for the Mediterranean. Studies and Reviews, Rome, FAO, 63-86
Zaitsev, Yu.P., (1998) Eutrophication of the Black Sea and its Major Consequences.
In: Black Sea Pollution Assessment. Edited by L.D. Mee and G. Topping. New York:
United Nations Publications, pp. 57-67
Zaitsev, Yu.P. and Alexandrov, B.G., (1998) Black Sea Biological Diversity. Ukraine.
New York: United Nations Publications, 351 pp
Zaitsev, Yu. and Mamaev, V. ( 1997) Marine Biological Diversity in the Black Sea. A
Study of Change and Decline. New York: United Nations Publications, 208 pp.
Zaitsev, Yu.P., Polischuk, L.N., Nastenko, E. V. And Trofankhuk G.M., (1988)
Superconcentrations of the Noctiluca miliaris Suriray in the neustonic layer of the
Black Sea. Doklady Acad. Nauk Ukr.SSR, 10, pp. 67-69 (in Russian).
Zedler, J., Winfield, T. and Mauiello, D. (1978) Primary productivity in a So.
Carolina estuary. In: Coastal Zone `78. Symposium on Technical,
Environmental, Socioeconomic and Regulatory Aspects of Coastal Zone
122
Management, Vol II, 649- 662. American Society of Civil Engineers, New
York.
123
APPENDIX A DATA ANALYSIS
A.1 River Concentration and Flow Data
All data manipulation can be undertaken using Excel spreadsheet software, with
output files stored on an Access database. Statistical analysis of output files can be
performed using the AARDVARK (Analyse Any Routine Data, Visually Acquire
Real Knowledge) software package (WRc plc) which has already been selected for
seasonal water quality data analysis within the Danubian countries. The choice of
AARDVARK is due to a functional ability that allows data sets to be de -seasonalised.
It should be noted that because of the statistical procedures utilised in the
AARDVARK software, and the highly skewed nature of daily load data, for the
purposed of trend or step analysis all data should be log transformed to normalise the
distribution prior to analysis. An example of this is shown in Figure A1.
Figure A1
AARDVARK time series analysis showing statistically significant (P <5%)
changes in inorganic nitrogen daily loading rates from theriver Glaslyn to the Glaslyn/Dwyryd
Estuary, Wales (UK) (Parr et al 1999)
AARDVARK is a very useful tool for temporal step analysis (it detects sudden,
statistically significant changes in concentrations or loads) and is likely to be very
useful for the analysis of loads to the Black Sea and concentrations within the Sea.
However, AARDVARK it is not designed for the purposes of trend analysis, since
data show ing a statistically significant trend may not contain statistically significant
step changes. Since AARDVARK was first produced, the suite of WRc statistical
software for the design of monitoring programmes and interpretation of monitoring
data has expanded considerably. The most notable advance occurred as a result of the
Integrated Environmental Monitoring work programme undertaken for the English
and Welsh Environment Agency in the UK (Wyatt et al 1998). This has resulted in
the production of statistical software which performs both step and trend analysis.
The calculation of in -stream nutrient loads (and any pollutant loads) from point
sources to a large waterbody may appear to be a simple procedure and, indeed, this is
124
the case if the concentration varies little and flow is measured frequently. But error
and variability can be introduced due to a range of factors, such as:
� Analytical precision (the variability in results when the concentration of a single
sample is measured many times).
� Accuracy or bias (how close the average of these values is to the actual
concentration in the sample and, if different, whether the average concentration
over- or underestimates the concentration.
� Limits of detection used for the analysis - what proportion of determinations are
less than this value.
� The quality of flow monitoring data.
� Whether the flow and concentration data are collected at the same site on the
river.
� Whether the sample is representative of the water passing that point across the
whole river cross sectional area at the time of sample collection.
� The relationship between concentration, load and river flow, and the degree of
scatter associated with these relationships.
Thus, calculated nutrient loads should always be presented with an indication of the
confidence associated with such estimates. Such calculated loads should not be
regarded as absolute values, but rather as an indication of the likely load. Wyatt et al,
1998) demonstrated that on the most downstream freshwater sampling site on the
River Thames, estimated in-stream annual loads based on weekly spot sampling and
continuous flow monitoring were accurate only to within �25%, while estimates
based on monthly spot samples may easily have erred by � 50%. Clearly, the greater
the sampling frequency the more confidence associated with the estimation of
instream loads. We suggest that weekly sampling of nutrients should be undertaken in
all major rivers feeding the Black Sea.
Thus, a 10% or 15% decrease in the estimated instream N or P load will be of no
significance whatsoever if the 90% confidence limits associated with that load are
�25%. Such a decrease in loads could well be followed by a 20% increase in the
following year, and still not be significant. The calculation of confidence limits when
estimating river loads must not be considered a luxury, it is an essential part of data
analysis.
However, the larger the catchment area and greater the flow of a river, the lesser the
inter-annual variability. Thus, minor rivers draining catchments of, say, 300 km2 or
less, estimated inter-annual variability in phosphorus loads may vary by a factor of 3,
depending on sampling frequency (e.g. Parr and Wheeler 1996), even when no major
environmental changes have occurred in the catchment.
Two methods may be employed to calculate nutrient and suspended solids loads (Ellis
et al 1993):
1. The first method involves supplying mean flow data only for those days
when samples were taken for nutrients/suspended solids analysis. For such
rivers, annual loads can be calculated as the arithmetic mean of the
observed instantaneous (daily) loads multiplied by the number of days in
each year. Instantaneous loads are calculated as the product of sample
concentrations and mean daily flows. This method is routinely used by the
125
Environment Agency in the United Kingdom and under OSPARCOM for
estimating loads of Red List substances.
2. For rivers for which mean daily flows are provided for all or most days of
each year (instead of just the days when nutrients/suspended solids
concentrations were sampled) the following formula should used:
annual load = l � (Q q)
Where:
l = annual mean flow as calculated above.
Q = true mean flow over a period (usually 1 year but where flow data
were available for less than a full year Q is estimated from the full
period for which daily mean flow data were available).
q = arithmetic mean of daily flows on those days for which sample
concentration data are available.
In the second method, the factor Q q provides a correction that, in most
circumstances, improves the precision of the calculated mean annual load. No
confidence limits are presented.
126
APPENDIX B Proposed monitoring strategy for the Black Sea
KEY
M
Monthly
S/Y
Seasonal or yearly (monitoring frequency to be decided)
W
Weekly
Y
Yearly
M/2
T wice monthly
1/3Y
Once every three years
S
Seasonal
Shaded area reflect monitoring parameters identified for nutrients
General Ecosystem
Bathing waters
Special protected areas
Ports
Water
Sediment
Biota
Water
Sediment
Biota
Water
Sediment
Biota
Water
Sediment
Biota
PHYSICAL
Temp
S
W
S
M
Suspended matter
S
S
M
Salinity
S
S
M
Secchi disc
S
M/2
S
M
Colour
S
S
M
Floating debris
S
D
S
M
Gravimetric
> Y
>Y
> Y
Detergent
S
S
M
S
S
M
CHEMICAL
Dissolved oxygen
S
S
M
BOD
S
M
S
S
pH
M
H2 S
S
TOC
S
Y
S
Y
S
S
NO2
S
S
S
127
NO3
S
S
S
NH4
S
S
S
Organic N
S
S
S
Total N
S
Y
S
Y
S
S
PO4
S
S
S
Organic P
S
S
S
Total P
S
Y
S
Y
S
S
Silicon (dissolved)
S
S
S
CONTAMINANTS
Metals
S/Y
> Y
Y
S / Y
>Y
Y
S / Y
> Y
Y
Petroleum
S/Y
> Y
Y
S / Y
>Y
Y
S / Y
> Y
Y
hydrocarbons
Extractable
S/Y
> Y
Y
S / Y
>Y
Y
S / Y
> Y
Y
organic matter
PAHs
S/Y
> Y
Y
S/Y
> Y
Y
S / Y
> Y
Y
Lindane
S/Y
S/Y
S / Y
PCBs
S/Y
> Y
Y
S/Y
> Y
Y
S / Y
> Y
Y
TBT
S/Y
> Y
Y
S/Y
> Y
Y
S / Y
> Y
Y
Radionuclides
S/Y
> Y
Y
S/Y
> Y
Y
S / Y
> Y
Y
128
BIOLOGY
Chlorophyll
S
S
S
Phytoplankton
S
S
S
Zooplankton
S
S
S
Benthos
S
S
S
Macro phyto
benthos
S
S
S
Red Book species
1/3Y
1/3Y
1/3Y
Fish Stock
assessment
1/3Y
1/3Y
1/3Y
Mammals
1/3Y
1/3Y
1/3Y
MICROBIOLOGY
E.coli
S
S
M/2
Y
S
S
S
S
S
S
Faecal Strep.
S
S
M/2
Y
S
S
S
S
S
S
Pathogens
S
S
M/2
Y
S
S
S
S
S
S
Viruses
S
S
M/2
Y
S
S
S
S
S
S
Fungi
S
S
Y/2
Y
S
S
S
S
S
129
General Ecosystem
Bathing waters
Special protected areas
Ports
Water
Sedimen
Biota
Water
Sediment
Biota
Water
Sediment
Biota
Water
Sedimen
Biota
t
t
BIOLOGICAL EFFECTS
Organism
Y
Y
Y
Cellular
Y
Y
Y
130
APPENDIX C
A REVIEW OF ECONOMIC INSTRUMENTS USED FOR
NUTRIENT CONTROL
Preamble
This appendix has been included within the report solely to aid those responsible for
the assessment and the future implementation of economic instruments in the Black
Sea region.
The review details, on a world-wide basis, the following experience of economic
instruments used for nutrient control: (i) the range and type of instruments, (ii) past
research into economic instruments for N and P and (iii) cost structures. Economic
instruments presently in use for nutrient control within the Black Sea region are
provided at the end of the review. No attempt has been made by the authors to suggest
appropriate instruments for use within the Black Sea region as this is outside the
scope of the present study.
C.1 Key Aspects of Economic Instruments
Three key aspects of economic instruments that have been used worldwide to address
the issue of nutrient reduction and control are presented in this appendix. These
include:
�
Range and types of instruments: past and current research examining the
range and types of models for the application of economic instruments.
�
Control costs: past and current research examining the cost structures and
patterns faced by agents responsible for nutrient pollution, and
�
Damage costs/benefits: past and current research examining the total and
marginal damage associated with activities leading to a reduction of
nutrient pollution.
C.1.1 Key issues of nutrient control
1. The variability of the effects of nutrients given the concentration, weather
conditions, the nature of the waterbody, season, crop type, type of soil.
2. The varied nature of potential damage including human health and the
environment.
3. Uncertainty regarding optimum economic fertiliser application rates, particularly
for organic fertilisers, and consequent surplus use.
4. The influence of various related policy objectives - national aspirations, EC
Directives (environmental and health related).
5. The range of instruments available - product charges for phosphate detergents,
charges on chemical fertiliser nutrient content, charges with rebates to reflect local
131
conditions, tradable permits for fertiliser use or purchase, permits based on proxy
measures such as stocking rates.
6. The inelasticity of demand for commercial fertilisers.
7. The interrelationship between chemical fertilisers and other inputs and the
difficulty of "accounting" for all farm fertiliser usage.
8.
.
The potential for point � non- point permit trading
C.2 Range and type of instruments used for nutrient control
A wide range of publications dealing with the comparative analysis of policies to
control N and P are in evidence worldwide.
Table C.1 summarises the range of economic instruments that have been or are
currently applied.
Table C.1
Inventory of economic instruments
Economic
Comment
Instrument
Taxation
Any scheme where a charge is made on a product or activity.
Terms like levy, charge, tax are generally interchangeable.
Applied in a number of countries: Sweden, Austria, Netherlands,
Belgium, Germany and Norway. Application is either at the
manufacturer sales stage (Sweden) or on manure surpluses/on
farm mineral balances (Netherlands, Belgiu m, France).
Liability (fines)
Fines (as opposed to taxes) on excessive nutrient application as
applied in Denmark.
Direct
Payments made to agents to secure specific environmental goals.
Payments/Subsidy
Incentive element most important where schemes are voluntary.
Applied in many countries: Germany, Sweden, UK and the US.
Technically should include public provision of advice/assistance -
which is widespread.
Cost sharing
Similar to direct payments but with contribution from the polluter.
Applied widely in the US. Economic incentives paramount in cost
sharing bid procedures.
Tradeable rights
Allocation of rights to a specific pollution quota, e.g. catchment
wide maximum daily load. Main experience in the US although
still at a developmental stage.
Cross compliance
Typically where a non environmentally orientated direct payment
is tied to environmental compliance. Applied notably in the US
and Switzerland.
Eco-labelling
Labelling of products which have been produced using
environmentally appropriate methods and materials. Applied in
Switzerland and the US (not nutrients). To some extent applied in
other countries in terms of "organic farming".
Rights purchase
Similar to direct payments - involving the purchase of an agents
right to pollute and typically conservation banking of this right.
Some experience in the US.
132
The following section provides more detail on a number of these approaches in
Sweden, Switzerland, the US, Netherlands, Denmark, Germany, France and other
.
countries
C.2.1 Sweden
Kumm (1990) discusses Sweden's efforts to control nutrient pollution from
agriculture, which as well as fertiliser taxes includes intensive extension programmes
and incentives. Although the programmes have raised revenues and been useful in
local circumstances it is argued that their efforts have been swamped by other policies
which have tended to exacerbate the problem.
Some form of charge on fertilisers have been used in Sweden since 1982. This began
with a "price regulation charge" and evolved into a tax. The original aim of the price
regulation charge was to finance the reduction in surplus cereal production/export.
The charge gradually increased to 20% of the price of fertilisers in 1990. In 1984 an
environmental charge was introduced, which by 1990 was about 10% of the price of
fertilisers (in addition to the price regulation charge).
Kumm reports the difficulty of assessing the impact of the tax and charge given the
other policies and trends occurring at the same time (such as that available for food
protein levels which has encouraged fertiliser use and growing environmental
awareness in the agricultural community).
The Swedish Environmental Protection Agency (SEPA 1997) present an evaluation of
the taxation system used for commercial fertilisers. It is stated that the purpose of the
tax was to reduce demand and to fund a programme to reduce the impacts of
agriculture on the environment. The price regulation charge ceased in 1993. In 1995
the environmental charge was converted to tax status. While the "pr ice regulation
charge" applied to nitrogen, phosphorus and potassium, the fertiliser tax applied only
to nitrogen and phosphorus. In 1994 the charge on phosphorus was abolished and
replaced with a charge on cadmium.
The original charge on cadmium applied to fertiliser containing above 50 g.tonne-1. It
was adjusted quickly when it became apparent that no commercial fertiliser had a
cadmium content in excess of 50 g.tonne -1. Revenues from the current charges are
estimated as SEK 300m ($35m - the vast majority of which comes from nitrogen).
The percentage of price accounted for by the charge has varied over the period of
implementation - at its height the charge represented 30% to 35% of the price but is
now at about 20%.
Originally administered by the Natio nal Board of Agriculture the tax is now
administered by the Darlana County Tax Authority. The charge is levied on fertiliser
manufactured in Sweden or imported. Manufacturers and importers are required to
register, submit returns and pay the tax on the qua ntity they deliver each month. Of 45
registered manufacturers, 37 import for resale, 5 import for re-use and only 3
133
manufacture in Sweden. Some "undeclared import for own use" is known to occur but
is not considered to be widespread.
The tax is considered to be easy to administer. The National Board of Agriculture's
administration costs were estimated as SEK 0.5m annually ($600,000). SEPA suggest
that the total costs amount to 0.8% of revenue - assuming that the manufacturer's
administration costs are equivalent to those of the authority.
It is estimated that the charges have probably reduced fertiliser use by 10% to 20%. In
its evaluation of the tax the National Board of Agriculture concluded that the main
impact had been indirect - through the action programmes financed as a result of the
tax. These programmes have continued despite the conversion of the charge into a tax.
C.2.2 Switzerland
Curry and Stucki (1997) describe Swiss agricultural policy which has developed
separately from other European states. It is described as a "progressive direct payment
system". A wide range of direct payment (subsidies) are in evidence based on an
equally wide range of objectives. Payments are made as:
�
compensatory payments - for general benefits in the public interest (e.g.
supplements for grassland farms),
�
supplements for farming in difficult areas,
�
compensation for lower yields as a result of extensification,
�
payments for particular types and means of production,
�
social payments - to encourage small family farms.
The payments have an explicit role in the provision of public interest benefits (non-
market goods). As in the US participation is voluntary, although cross-compliance (to
receive price support) is also used. Evaluation criteria are linked to the payments
which may be withheld (or need to be reimbursed) if the criteria are not met.
Various levels of direct environmental payments are available based on the level of
"ecological" farming involved:
�
Biological diversity on farmland - requiring extensive grassland
cultivation and other add-ons to traditional farms.
�
Integrated production (IP ) - which applies to the whole farm and requires
reduced inputs and the attainment of ecological and animal welfare targets
above the norm. A "well-balanced use of fertiliser" according to farm
requirements (e.g. a phosphorus balance of 10% in excess of that required
by the vegetation) is stipulated.
�
IP with eco-labelling - which allow farm produce to be labelled and
achieve price premiums from consumers in return for conditions more
exacting than IP alone.
�
Organic farming - recognised as a distinct farming system and attracts
the highest levels of direct payments.
The tiered system is seen as a method to progressively encourage farmers to achieve
ecological farming as a whole. Apart from the direct payment incentives other
incentives are obviously operating (e.g. moving into the IP and organic schemes
involves costs but allows entrance into the premium organic produce market).
134
The cost of the whole scheme in 1993 was 55m CHF ($36m) and is probably closer to
500m CHF ($350m) currently. The vast majority of farms in Switzerland operate in
one or all of the schemes - in 1995, 40% were either IP or organic. As Curry and
Stucki (1997) point out there are many similarities between the Swiss program and
other schemes in operation in EU member states such as the nitrate sensitive areas
piloted in England and Wales or the MEKA programme in Germany's Baden
Wurttemberg. What distinguishes the Swiss example is the degree of participation, the
national coverage and the integrated nature of the approach.
C.2.3 United States
The main experience in the US has been with voluntary direct payment systems and
tradeable rights. However, other economic instruments are also used. Francis (1992)
reports that some US states employ a small tonnage tax on fertiliser production to
support educational and research efforts. Farmers, and the industry appear to be
amenable to such policies. Liang (1998) also reports that some states apply taxes on
fertilisers but no federal programme operates.
Reichelderfer (1990) reports on the mainstream US experience, tied as it is mainly to
erosion control strategies, with the use of incentives through cross-compliance.
American agricultural policy has been characterised by a wide range of programs
aimed at specific objectives in which farmers can voluntarily choose to participate
based on the degree of incentive to them. The main programmes can be classified as:
�
Technical assistance programmes - publicly provided technical
assistance, in the context of economic instruments, needs to be seen as a
subsidy for the development of human capital on farms. The major
programme has been the Conservation Technical Assistance Program.
Programmes have been criticised for discouraging the conservation of
wetlands.
�
Conservation subsidies - the federal Agricultural Conservation Program
provides cost sharing assistance to farmers. Many programmes have been
criticised for focusing on cost-sharing for production rather than
conservation programs.
�
Land rental for cropland conversion and retirement - the Soil Bank
program for example, where farmers are paid annual rents to take land out
of production. The Conservation Reserve Program is similar although
funds are distributed through a quasi-bid system. To gain entry in a CRP a
farmer must "bid" a rental amount. Only where the bid is below the
maximum acceptable rental will the land be entered.
�
Cross-compliance incentive programmes - the main scheme,
conservation compliance, involves the adoption of certain restrictions in -
order for farmers to continue to receive US Department of Agriculture
benefits.
Neilsen et al (1989, reported in Reichelderfer) reports that conservation investment
has been more influenced by macroeconomic factors (interest rates, market
expectations etc.) than by the various incentive programmes. Significant impacts are
only found to occur when the macroeconomic conditions are right. As these are
outside the control of the programme, a high degree of uncertainty is associated wit h
the outcome of such programmes.
135
Reichelderfer also points to the issue of counter and co-incentives operating within
the variety of measures applied in the US. While co-incentives promote synergy,
counter-incentives have the effect of cancelling each other out because the incentives
are pulling in different directions. Conservation incentives for example are counter-
incentives to agricultural commodity market support. Cross compliance programmes
can be seen as being aimed at resolving the mixed incentives. Shortle and Laughland
(1994) also point out that most evaluations of the effectiveness of economic and other
policy instruments tend to ignore possible responses from other measures (e.g.
increased price support) and consequently overestimate the likely effectiveness and
underestimate the costs.
Helfand and Archibald (1990) report on California's Proposition 65, which involves
labelling standards and public exposure restrictions for chemicals used in agriculture.
Although directed mainly to toxic substances the approach has possibilities in terms
of fertilisers and it could be argued that "organic labelling" of products has provided
incentives for the reduction in fertiliser use.
Some experience has been established in the US through the use of watershe d based
trading arrangements (USEPA 1996). Table C.2 summarises the extent of experience
in 1996.
Table C.2
US experience in tradeable rights
Area
Trade
Pollutant Comments
Cherry
PSNPS
P
Point sources can earn credits by
Creek, CO
developing non-point source phosphorus
controls. Implementation delayed because
of an as yet unmet requirement for urban
non-point sources to be halved before
trades can take place.
Lake Dillon,
PSNPS
P
Wastewater treatment plants receive load
CO
NPSNPS
credits by purcha sing non-point source
reductions. Few PSNPS and attention
has shifted to NPSNPS.
Tar Pimlico
PSNPS
N
Wastewater treatment plants receive
R Basin, NC
credits for nitrogen load reductions by
paying $85 per kg into a cost share fund
which is used to support agricultural
BMP's. Pollution control was thought to
entail a cost of $375 to $750 per kg.
Note: PS - Point source, NPS - Non Point Source
A variety of schemes are reported to be at developmental stages. The majority
of these are point to non point systems.
The report of USEPA is also useful in that it provides a framework for analysing
situations in which trades may take place. The report stresses the incremental
opportunities of trading and the development of partnerships at a watershed level.
Five generic trading possibilities are discussed (point to point, intra-plant, pre-
treatment trading, point to non-point and non-point to non-point). Two trading
mechanisms are identified:
�
trades within a total maximum daily load (TMDL), and
136
�
trades within a point source permit.
Factors understood to influence the possibility of trading include: trading ratios (i.e.
trading price), transaction costs, uncertainty and its alleviation, number of participants
and availability of cost data. A number of worksheets are detailed which allow the
screening of trading possibilities. Adler (1994), however, points out that progress on
calculating maximum watershed loading rates has been slow.
The Pamlico-Tar Nutrient Trading Program's first phase (see Section 1.4) has largely
been the subject of praise from the state, dischargers, and environmental groups. By
addressing non-point sources, the state and environmental groups have gained a
reduction program that is more comprehensive than the original NSW strategy.
Dischargers are benefiting from the increased flexibility and cost-effectiveness of the
trading approach. However, Phase 2 will be met with a number of challenges,
including tracking compliance, determining accountability, and making sure that load
reductions are ac tually achieved. The trading program is designed so that once a
discharger makes a trading payment to the state for BMPs its responsibility for that
share of pollutant reduction ends for that year. The $56 per kilogram per year trading
factor is also a subject of continued debate. The technical basis for the value is poorly
documented and must be further validated. In addition, the plan does not include
provisions for escalating the factor due to inflation or other factors. The Association
has applied for a USDA grant to study BMP effectiveness to address these challenges
in Phase 2.
Boggess et al (1993) report on the development of management options to control
phosphorus pollution of the Okeechobee. Management developed through the use of
Agricultural BMP's but in 1987 led to the development of a novel rights purchase
strategy whereby the state purchased the rights of the farmers to undertake dairy
operations at a cost of $600 per cow. The ownership of the land capital equipment
remained with the farmers. This rights purchase operated on those farms where the
traditional cost sharing approach to the implementation of BMP's was considered by
the farmers as too expensive.
Lichtenberg et al (1993) report on the cost sharing and technical assistance
programme in Maryland. Traditional economic theory argues against subsidy type
arrangements (such as cost sharing and the free provision of technical assistance) as a
method for pollution control because they contain an incentive for industry expansion
(e.g. through entering land in programmes that would not be cultivated otherwise). A
counter argument is that such arrangements can be effective for small farmers who
could not otherwise afford to comply with regulations. Lichtenberg's analysis of cost
sharing programmes in Maryland, however, shows that it is the larger farms who tend
to participate. The implication is that there remain barriers to effectively reaching
small farmers through cost sharing agreements and that they should perhaps be
regulated in a different manner from larger farms.
Kozloff et al (1992) report on the interest in the US shown in the concept of micro-
targeting whereby state aided control programmes target a ranked set of land parcels
rather than being applied to the catchment as a whole. Significant benefits from
micro-targeting of measures are shown. Targeting is accomplished using
disaggregated information about physical and economic factors that influence benefits
and costs of adopting alternative land management techniques. Cost effectiv eness of
the strategy increases with the incorporation of further information on the
heterogeneous economic factors (opportunity cost of the retired land) and physical
137
factors (contribution of the land to downstream load) that exist within the catchment
(see also Fox et al 1995).
C.2.4 Netherlands
The OECD (1995) discusses a surplus manure tax applied in the Netherlands. The tax
is applied to the production of animal manure according to the weight of phosphate
produced. A tiered system operates with farms producing less that 125 kg.ha -1.yr -1
paying no tax. For farms producing 125-200 the tax is 0.25GL rising to 50GL for
farms producing more than 200 kg.ha -1.yr -1. The Netherlands has recently introduced
compulsory mineral budgets for farms as part of the National Environmental Policy
Plan.
The use of a levy on manure in the Netherlands needs to be seen within the broader
policy on manure and ammonia, which began in the early 1980s and is now in its third
:
phase
� Phase 1: stabilisation of the environmental burden - involving manure
production rights and use standards for livestock manure,
� Phase 2: reduction in environmental burden - tightening of use standards,
� Phase 3: achievement of equilibrium.
Phase 3 involves a mainly targeted approach on those farms associated with the
greatest burden (greatest mineral losses per unit area). It was decided that mineral
losses per hectare would be too difficult to measure and stocking rates were chosen as
a proxy measure. As livestock registration is already required such requirements
would be administratively efficient. A `Minerals Accounting System (MINAS)' is
required for farms with more than 2.5 livestock units per hectare reducing to 2
units.ha -1 in 2002 (1 livestock unit = 1 dairy cow). Registration of mineral looses is
required for pig and poultry farmers, mixed cattle and intensive cattle farmers.
MINAS involves the registration of mineral inputs (nitrogen and phosphate) used on a
farm in fertiliser and animal feeds, and the mineral output in the form of products and
manure (Mineral loss = Input (fertiliser and feed) - Output (product, manure))
Where the loss is larger than the allowable standard the farmer must pay a levy.
MINAS has been developed jointly between industry and government. It is felt that
MINAS doe s not require much administration for farmers as the required data are
already part of normal financial administration of the farm. The burden on the
government, however, is stated as being "considerable".
Farmers are allowed to declare either an exact (measured) mineral loss or a standard
amount. Reporting exact losses provides an incentive for some farms to more closely
track their mineral balances in return for savings. That part of mineral losses regarded
as acceptable is termed the loss standard and no levy is paid on this amount. The
phosphate and nitrogen loss standards are set to fall from 1998 to 2008 as detailed in
Table C.3.
It is estimated that livestock farmers would see a 3% reduction in income as a result
of these standards. For pig farmers this would be more like 15% while poultry and
arable farmers are not expected to be affected.
138
As shown in Table C.3, a progressive taxation system is used, with for example, a rate
of 5 Dfl.kg-1 on the first 10 kg above the loss standard rising to 20 Dfl for any further
losses. The levies have been set so that they are higher on average than the most
expensive disposal option - to encourage farmers to invest in alternative disposal
options (improved feed, manure application management and manure redistribution)
rather than pay the levy.
Table C.3
Development of the Dutch manure levy
1998 2000 2002 2005 2008
Phosphate loss standard (kg P2O5.ha-1)
40
35
30
25
20
Nitrogen loss standards (kg N.ha -1)
300
275
250
200
180
Low levy (dfl 5) for phosphorus loss (kg P2O5.ha-1)
40-
35-
30-
25-
50
45
40
30
Low levy (dfl 5) for phosphorus loss exceeding
50
45
40
30
(kg P2O5.ha-1)
Phosphorus supply standard
85
80
80
80
on grassland
120
on arable land
100
One option potentially available to farmers is obviously to export their surplus manure
to other farms - notably arable farms not subject to control. To combat this a manure
supply standard also operates which stipulates the amount of manure each farm is
allowed to accept.
Other notable features of the Dutch policy include the progressive retirement of rights
for manure production. A proportion of rights are not tied to the land and can be
siphoned off when title is transferred. Several million kg of phosphate are likely to be
reduced by 2002 in this way. A provision is included whereby the relocation of a farm
is subject to lower reduction in production rights than sale. This policy is seen as
incorporating an incentive for farms to relocate to less sensitive areas. In addition a
rights purchase based restructuring fund has been set up to purchase rights not
attached to the land. Apparently these rights can be freely traded on the market
although the extent of trading is not clear.
C.2.5 Belgium
In Belgium a tax applied to surplus manure has operated since 1991 in the Flemish
region. A base charge is levied on the nitrogen and phosphate content of surplus
manure and a disposal change is levied on quantities disposed by Mestbank (the
organisation established with responsibilities for manure disposal). Frederiksen
(1994) also discusses the taxation of calculated farm mineral surpluses in Flanders
and the requirement for large livestock farms to pay a levy based on manure
production in the Walloon region.
van Gijseghem (1997) reviews the imple mentation of nitrate policies in Flanders. As a
result of the Nitrate Directive a Manure Action Plan was developed which included a
139
combination of command and control regulation with an economic instrument in the
form of a levy, in addition to education and awareness measures. The problem with
manure in Flanders is due to explosive growth in livestock production in the last three
decades. Part of the problem related to the economic stimulation of land independent
livestock farms near manufacturers of feed (who were in turn generally located close
to harbours and rivers for production processes).
The 1991 Manure Decree established limits to the use of fertilisers, mineral
production coefficients, a definition of manure surplus and a levy based on the
define d surplus. The nitrogen and phosphate production at farm level serve as a basis
for the calculation of a levy. According to van Gijseghem farmers have no incentive
to change farm manure production because the levy is too low to provide an incentive
to reduce livestock production.
Rather than use the levy as an incentive mechanism strict disposal rules have been
developed. A quota system exits at a regional level with the region divided into white,
grey and black areas. In white and grey areas (phosphate production is lower than
100 kg.ha-1) and is allowed to grow to 100 kg.ha -1. In black areas production is greater
than 125 kg.ha -1 and growth is only permitted if production is reduced elsewhere.
Limited disposal routes have required intensive farms to tra nsport manure long
distances to receiving farms and from 1999 onwards to manure processing plants.
C.2.6 Denmark
Schou (1997) reports on the Danish Plan for Sustainable Agriculture which contains a
system of fines for excessive nitrogen use. The original plan was introduced in 1991
with the rules enforced from 1993. The aim was to ensure a better utilisation of
nitrogen in manure, with utilisation standards set together with rules to ensure that the
amount of nitrogen in fertilises and manure at farm level must not exceed the
estimated need for nitrogen.
The farm level need for nitrogen is calculated on the basis of cultivated area and a
crop specific standard coefficient. The standard coefficient has a number of
adjustment factors reflecting soil type, climate zones, and expected yield (with further
adjustments available if accompanied by documentary evidence).
A value is calculated for each farm (u) representing the utilisation of manure on farm.
This is calculated as:
N - Nf
u =
Nm
Where N is nitrogen (kg) and the subscripts m and f denote nitrogen in manure and
fertilisers respectively. As Schou observes, if u is taken as fixed as is the case given
the minimum utilisation standards then this rule is equivalent to a quota at farm level.
To implement the regulations farmers must make a plan regarding, crop rotation,
available manure and the purchase of fertilisers. Available manure is calculated with
reference to the number and combination of livestock on farm. Purchased fertilisers
are measured (and checked) with regard to farm accounts.
140
The fine/charge is made on farmers who do not make a sufficiently high utilisation of
their manure. According to Schou the fine is proposed to be set at about 20 DKr per
excessive kilogram plus a fixed change of 1000 DKr.kg-1. Hence 10 excessive kg's
would attract a charge of 1,200 DKr ($170). The system is enforced through a series
of spot checks, of which over 30,000 were carried out in 1993/94 representing 30% of
the total farm population.
A major issue associated with the Danish system is the ability of farmers to
overestimate expected yields (which were not cross checked with historical records).
There is an incentive, therefore for farmers to overestimate yields to secure
compliance. From 1996/97 this was corrected by ruling that if nitrogen application is
to exceed the standard nitrogen need (based on expected yields for crop types and
areas) then this needs to be argued by the farmer on the basis of historical yield
records or by the results of soil analysis.
C.2.7 Germany
The main areas of high nitrate concentrations are located in Northern Germany
(Niedersachsen) as a result of intensive farming (maize, potatoes and sugar beet) and
livestock raising and in other regions because of specialised crops (vegetables and
fruit).
The general aim is to control the nitrate problem through changes in agricultural
practice, with water treatment seen as a last resort. There has long been an acceptance
of the principle of paying compensation to farmers for the loss in yield associated
with measures to restrict nitrate pollution. This principle was first put into practice in
Baden-Wurttemburg in 1986 where the "ecology programme" of the State
government outlined measures to safeguard drinking water quality and payments to
farmers for reductions in income due to the application of less intensive farming. The
state regulations for "Protection Zones and Compensation" came into law in 1987.
The regulations amended the water law of Baden Wurttemburg to legalise the
levelling of charges for the abstraction of water with the revenue providing the funds
necessary for the compensation to farmers. The system can therefore be thought of as
an instance of the "beneficiary pays" principle. in that a tax is levied on the parties
potentially benefiting from the nitrate reductions (water abstractors). The amended
water law laid down the charges shown in Table C.4 for abstractions. These are
highest for public water supply, but abstractions from groundwater and most
industrial uses are charged higher than, for example, abstraction for crop irrigation.
Under the regulations the farmer can either opt for a lump sum payment
(approximately $150 per hectare when introduced (this includes approximately $45
for the use of approved pesticides) obtainable without needing to prove actual income
loss, or apply for an actual assessment of loss. It is generally felt that the standard loss
figure is generous for most crops and that individual applications were made difficult
in order to keep the administrative burden low. In only a few cases (5%) would it be
profitable to apply for an actual loss assessment (e.g. for specialised crops such as
asparagus and strawberries). This would be expected to restrict the incentives for
farmers to go beyond the loss standard.
Table C.4
Abstraction charges in Germany
Abstraction purpose
Charge DM.m-3
141
For public water supply
0.1+VAT
For geothermal power generation
0.01
For cooling water from surface water
0.01
For irrigation water from surface water
0.01
For other industrial water from surface water
0.04
For abstractions from ground water
0.1
Strictly, compensation is payable if the soil nitrate concentration is less than
45 kg NO3-N.ha-1. However, this was widely viewed as unrealistic and compensation
was actually given if concentrations were above this level but reducing over time. The
compensation arrangements, therefore, require a substantial monitoring programme -
with 150,000 locations aimed at being sampled annually. It was hoped that these costs
would reduce as better field tests were developed (at introduction sampling costs were
approximately $1.5m given costs per location of $10.5 with total costs including
administration etc. running at $5m). The payments are made ahead of the growing
season and claimed back if the conditions are not met.
Some of the funds raised by the levy are used for educational programmes. In addition
approximately 100 model farms were set up, reflecting all as wide a range of
climactic and growing conditions in the state, where farming is undertaken in strict
accordance to the rules governing good agricultural practice. Should exceedences be
experienced in these farms (e.g. because of extreme climatic conditions) allowance is
made in the compensation arrangements. It should be noted that at the time of
introduction in Baden Wurttemburg it was envisaged that the compensation payments
would run parallel to a system of fines (for soil concentrations above 90 kg NO3-N.ha-
1). The fine system was not approved, however.
C.2.8 France
Versmersch and Raould (1997) report on a levy system applied by French River Basin
Agencies regarding nitrate pollution. The main problems in France relate to animal
intensive livestock farming and consequent animal wastes. Brittany is the region with
the greatest problem with regard to intensive livestock production.
The 1964 Water Act introduced a system of fees for point sources covering a wide
range of pollutants. The revenues are distributed to dischargers as grants, soft loans
and rewards for abating pollution. There has also, since 1975, been a clear legal basis
for imposing fines on non-point sources. In 1982 there was a proposal (never realised
because of the opposition of farmers unions) to impose fines on pig farmers per pig
according to disposal availability and spreading quality. In 1991, however, the French
government decided to address the nitrate problem by introducing a levy on nitric
nitrogen with the aim of extending the polluter pays principle to cover agriculture.
The levy covers four substances in livestock farming, suspended solids, oxidisable
matter, reduced nitrogen and reduced phosphate. There are three steps to the
calculation of the levy for an individual farm. Firstly emissions are calculated for each
pollutant and each category of livestock. Coefficients are used to translate the number
of animals into quantity of polluting substances and from this a gross charge is
estimated.
Secondly, farms are classified according to a number of parameters including storage
capacity, location of buildings, run-off from buildings, manure spreading scheme and
142
livestock density. Through this procedure farms are placed into one of nine categories
reflecting abatement performance. The value of abatement performance is then
calculated in monetary terms to arrive at a farm premium.
Finally the net charge is calculated as:
Net Pollution Charge = Gross Pollution Charge - Abatement Premium
If the net pollution charge is greater than a specified level (6,500 FF or $1050) which
according to Versmersch and Raould represents a population equivalent of 200 and
the "monetary equivalent of the farmer's rights on the environment", then a charge is
payable.
The fee system was intended to be introduced in stages with subsidies given at early
stages to ease transition. Protests from farmers groups (notably pig producers because
of the exclusion of mineral fertilisers) lead to a delay in the implementation schedule.
Large farms entered the scheme in 1995 with the scheme operational by 2000 but
farmers will only pay full charges in 2003 because of transitional arrangements.
The information for applying the charges is derived from a compulsory farm
environmental audit. This audit represents the point of departure for negotiations
between the basin agency and the farm with the objective to achieve individual
agreements which would reduce the net charge (e.g. through an enhanced abatement
premium). Any such investment would then be state subsidised (up to 60%).
According to calculations by Versmersch and Raould the total cost of the programme
for France would be in the region of 12 to 16 billion FF ( $2 to $2.6 billion).
C.2.9 Other countries
The majority of evidence on the experience of other countries relates to various forms
of fertiliser tax applied in Northern Europe. The OECD (1995) discuss the Austrian
fertiliser levy which was introduced in 1986. Despite being applied at a low level, this
is described as having a significant effect on fertiliser use. No further information on
this le vy was available.
A fertiliser tax has also been applied in Norway since 1988. The tax is paid by
wholesalers based on the content of nitrogen and phosphorus. Rapid increases in the
tax were witnessed in the first years although overall the increases have lagged behind
general price inflation. In 1995 the tax represented approximately 20% of the product
price.
It is understood (OECD 1995) that Finland operated a fertiliser tax which was applied
to the nitrogen and phosphorus content which was repealed in 1994. The tax is
described as an excise tax and was 2.60 Finnish Marks.kg N-1 and 1.7 Finnish
Marks.kg P-1 ($0.45 and $0.3, respectively) and raised a revenue of 516 million FIM
in 1993 ($90m).
C.2.10 Experience with Applied Economic Instruments � Summary
143
Table C.5 summarises experience with economic instruments in a number of countries
on the basis of a number of common themes:
� the objective sought in introducing the instrument;
� the nature of the instrument ( tax, fine, subsidy, etc.);
� the coverage (nitrogen, phosphorus, both);
� the nature of the wider regulatory system within which the instrument
operates;
� the level of application (e.g. amount of the charge or scale of application);
� issues related to administration, including costs etc.;
� the existence of complimentary measures; and
� an assessment of effectiveness.
144
Table C.5
Summary of applied economic instruments
Economic
Fertiliser taxation Direct payment
Tradeable rights
Levy on mineral Manure levy in
Nitrogen fines in German water tax French pollution
instrument
in Sweden
with eco-labelling in US
balances in
Flanders
Denmark
and compensation charges
in Switzerland
Netherlands
(Belgium)
scheme
Objective
To reduce demand To secure public To secure cost
Balance on farm Sustainable
Better utilisation Mainly drinking
Combat problems
for chemical
interest benefits
effective
inputs and outputs mineral use on
of Nitrogen in
water protection of intensive
fertilisers and
from agriculture
watershed
of minerals
farms and meeting manure
(high reliance on animal husbandry
fund programmes
improvements
requirements of
groundwater)
Nitrates Directive
Nature
Tax on
Compliance with Varied. Generally Levy on surplus
Tax on surplus
Fines for
Tax on abstraction Tax on "net"
manufacturer
environmental
some credit
minerals, manure manure
excessive use of used to
pollution potential
sales at point of
objectives allows earned by point
nitrogen.
compensate
(reflecting
delivery
entry to premium sources by
Effectively a
farmers for
abatement.
organic markets
securing
quota.
income loses
improvements in
alternative
sources
Coverage
Nitrogen (and
Integrated
Nitrogen and
Phosphate directly Nitrogen and
Nitrogen
Nitrogen and
Nitrogen and
cadmium).
Phosphorus
but fertilisers
phosphate
pesticides
phosphate
Phosphate up to
(incl. nitrogen)
1994
generally
Wider regulatory Not available
Progressive direct Direct payment, Agriculture sector Manure Decree.
Plan for
Not available
Subsidies for
system
payment system. cost sharing
targets.
Manure Action
Sustainable
pollution
Not part of
Plan involving
Agriculture
abatement
common
limits to the use of
investment
agricultural
fertilisers.
policy.
Table C.5
Continued...
Economic
Fertiliser
Direct payment Tradeable rights Levy on mineral Manure levy in Nitrogen fines German water
French pollution
instrument
taxation in
with eco-
in US
balances in
Flanders
in Denmark
tax and
charges
Sweden
labelling in
Netherlands
(Belgium)
compensation
145
Sweden
labelling in
Netherlands
(Belgium)
compensation
Switzerland
scheme
Level
Represents 20% 40% of farms
Trading activity 5 to 20 Dfl per Unknown
Base
Lump sum
Payable on net
of the price of
either
generally
kg of surplus
exceedence
payment based pollution costs
fertilisers. Has environmental
limited
charge
on standard
in excess of
been higher.
or organic
combined with a assessment
$1050 per farm.
farming
per kg fine. 10 equivalent to
kg excessive use $150 per
= $175
hectare.
Administration County tax
National
Local. National Regional
Region
National. High State (federal). Local river
Authority.
costs in setting authorities.
(Flanders)
level of
Requires
basin
Administration
up framework. Administration
monitoring (spot substantial
authorities.
costs thought to
costs
checks) seems monitoring (soil Administrative
be <1% of
"considerable"
to be required
nitrogen
cumbersome
revenue raised
(30% of farms) concentrations). because of need
Need for a large for farm
number of
environmental
model farms.
audits
146
Table C.5
Continued...
Economic
Fertiliser
Direct payment Tradeable rights Levy on mineral Manure levy in Nitrogen fines German water
French pollution
instrument
taxation in
with eco-
in U S
balances in
Flanders
in Denmark
tax and
charges
Sweden
labelling in
Netherlands
(Belgium)
compensation
Switzerland
scheme
Complementary programmes to Cross
Cross
Manure banks
Fertiliser use
Farm manure
Ecology
Grants, soft
measures
promote
compliance.
compliance.
for disposal of
restrictions.
plans.
program.
loans, abatement
extensive
Direct payments Voluntary direct surplus manure. Strict disposal
Educational
rewards.
farming.
payments.
Manure
rules and tiered
programmes.
Compulsory
Education and
Rights purchase. production
quota for
System of fines farm
awareness
rights (reducing production at
considered but environmental
programmes.
quota with
regional level.
not adopted.
audits.
Afforestation
governments
Development of
programmes.
right s purchase manure
and private
processing
trading).
facilities.
Manure supply Education and
standards. Farm awareness.
relocation
policies.
Effectiveness
"Swamped" by Regarded as
Limited
Will not achieve Incentive
Low originally Good. Adopted Unknown.
other influences. effective
compliance with element of
because of
in Badden
Staged and
Main impacts
Nitrates
charge is not
strategic
Wurttemberg
delayed
indirect
Directive.
effective but
behaviour by
but extended to introduction
(through tax
Netherlands
was not
farmers in
other states.
means only
funded
started with a
purpose. Main
exploiting a
large farms
programmes).
large problem
aim of charge
loophole.
incorporated.
Fertiliser use
compared to
was revenue
reduced by 10%
may European raising
to 20%
countries.
147
C.2.11 Experience with other sources
One of the issues which has only been briefly addressed is the possibility of charging
for the diffuse inputs of phosphorus from cleaning agents. The issue of controlling
phosphate inputs to receiving water through measures aimed at the detergent industry
and detergent users were widely discussed at in the late 1980s and early 1990s A
charge on detergents was also discussed at this time. However, a number of issues
were raised. Firstly, control would have a limited impact upon the overall problem -
reducing phosphorus inputs to sewage treatment works by about one third. Secondly
that such a charge would reduce phosphorus pollution in a blanket manner and
therefore not be cost effective in relation to more targeted approaches that could be
pursued by installing treatment technologies at sewerage works discharging to
"sensitive locations". Finally, the difficulty of deriving suitable replacements for
phosphate and the environmental impacts of the alternatives themselves have been
noted. Despite these drawbacks a detergent tax has received some attention (see Anon
1991), notably in relation to funding necessary investments in wastewater treatment.
As Morse et al (1993) notes, however, targeting detergent phosphorus sources has
historically been an important national response to eutrophication. Most responses
have taken the form of mandatory or voluntary restrictions based on adequate product
performance (Sweden, Finland, Netherlands, Switzerland, Germany, Austria, Norway,
Italy, France) followed by exclusion or severe restrictions by legislation (Switzerland,
Italy and Norway) or by market activity (Germany, Austria and the Netherlands). In
Germany for example during 1986/87 a combination of rising environmental
awareness and the availability of phosphate free alternatives produced a significant
shift in demand towards phosphate free detergents. The price premium associated
with such products is taken as evidence of a significant willingness to pay for possible
environmental improvements.
C.3 Empirical research into economic instruments for N and
P
Empirical research covers a much wider set of issues in terms of the design of
economic instruments and issues raised by their implementation than is evident in
their application.. The following sections are grouped by main themes and intended to
provide a starting point for more detailed assessment of the various issues. The main
themes are:
�
the need to target instruments to reflect local variability;
�
impacts of various control options on affected sectors;
�
integration with other policies;
�
barriers to implementation.
C.3.1 Targeting instruments to reflect local variability
There is a trade-off between designing economic instrum ents which are
administratively simple yet flexible enough to capture the high degree of local
variability associated with diffuse pollution from N and P. This has lead to
considerable research into tax differentiation and targeting of measures.
148
The closer an instrument is applied to the locality the greater will be its ability to
reflect local factors. Braden and Segerson (1993) provide a useful discussion of the
advantages and disadvantages of a number of policy tools at different points in the
lifecycle (production output, purchased inputs, emissions/management practices,
ambient concentrations and the use of liability for damage). Criteria used include the
ability to target (which increases from production to liability for damage),
enforceability (which tends to be higher upstream) and the correlation with water
quality (which increases the further from production). One conclusion might be that
combined approaches may be superior, however, it is shown that combined
approaches (e.g. input tax together wit h liability rules) may in fact produce an inferior
outcome.
Other researchers have focused on the stochastic nature of diffuse sources. Shortle
(1990) makes the point that cost effectiveness calculations of pollution reduction
involving stochastic emissions frequently base their evaluations on annual averages.
However, such calculations can lead to misleading results. Instruments which
recognise the stochastic nature of the pollutants are likely to provide superior
outcomes. This is to some extent reflected in the German compensation payment
scheme which make allowance for extreme climatic conditions.
Scheele (1997) discusses the choice of policy instruments in situations where the
problem is highly variable across space and time. It is argued that policies need to
recognise at least four components - the regulatory stimulus, technical point of
application, the addressee, and the spatial dimension. Most analysis focus on only one
of these choosing others by default. Practically, discussions regarding the choice
faced by regulators as between taxes, tradeable permits and direct regulation is
flawed, because the real issues of the problem (spatial scale, information requirements
etc.) are not differentiated in this typology. For example, direct regulation is good at
addressing site specific problems but may be inefficient where problems are
widespread and homogeneous.
Hodge (1997) discusses the possible application of land use permits as an alternative
to other regulatory options. Land use permits are shown to retain more precision in
application than taxes on input use. The potential for land use permits to become
traded commodities is also discussed. Land use permits can be designed on the basis
of the expected nitrate emissions from different land uses. Although less efficient than
a tax on emissions (leachate) such permits have been shown to be more efficient than
a tax on fertilisers. The problems of actually monitoring leachate, however, render
this result misleading. The estimated cost effectiveness of the alternatives is given in
Pan and Hodge (1994) as 7.8, 5.3 and 5.6 $.mg-1 nitrate avoided per hectare (in
leaching water) for the fertiliser tax, leaching tax and land use permits respectively.
Moxey and White (1994) report on an evaluation of nitrogen quotas applied at a
catchment level (North East England) to nitrogen input, output (export) and an input
quota targeted at individual land classes. Abatement functions for the three
approaches are presented showing the least cost option to be a nitrogen emission
quota. Targeted input quotas perform better than a non targeted input quota.
149
Hansen (1997) develops a model which recognises a further point in the life cycle of
nutrients which may be subject to economic incentives for the minimisation of
damage. Following input to land and emission to the environment other landscape
characteristics (of the land through which the pollutant is transported) affect the
ultimate level of pollution. Recognition of this fact introduces the possibility of
designing incentive structures to deal with nutrient pollution after emission (e.g. by
encouraging wetland construction and maintenance as preventative measures).
Clunies-Ross (1993) discuss the comparative benefits of a tax on nitrogen use as
opposed to a tax on production as well as other options. The report details the then
unpublished work of Dubgaard who suggested that a nitrogen tax of 150% and a
reduction in crop prices of 50% would achieve the same result in terms of reduced
fertiliser usage. Among the options dis cussed are taxes on fertilisers with variety of
compensation measures to reflect farm specific characteristics - increasing commodity
prices, per hectare based reimbursements and reimbursements for specified quantities.
Clunies-Ross also discuss issues associated with nitrogen quotas and animal manure.
In an tradeable input quota system the point is made that a key issue is the initial
allocation of quotas or entitlements in a manner which is satisfactory to all parties and
retains the right mix of incentives. In some circumstances it might be more
appropriate to tax surplus animal manure rather than mineral fertiliser. One option
dealing with multiple sources is the application of nitrogen balance sheets with
taxation based on "unaccounted for nitrogen" a principle pursued in a number of
European countries. Such balance sheet taxes would also deal with the problem of
substituting organic nitrogen for reductions in mineral nitrogen.
Francis (1992) discusses the relative merits of excise taxes for fertilisers, user rights,
application restrictions, zoning regulations and voluntary BMP's. A comparison is
made on the basis of cost, ease of enforcement, responsiveness to local problems,
political viability, producer income and equity among producers. One of the problems
with taxation systems is their perceived penalisation of farmers employing good
practice (since the tax is paid on all units not just those contributing to a problem). A
solution suggested is a tax rebate scheme, which would involve a high initial tax with
a rebate for farmers who can demonstrate good practice.
Randhir and Lee (1997) report on a simulation of the application of a tax on nitrogen,
a watershed level restriction on use and an acre level restriction on use, for the control
of nitrogen and atrazine. The simulation examined the impacts on the cropping
systems, input use, non-point source pollution, farm income and risk. Policies directed
towards single outputs have a variety of impacts on the levels of other pollutants, farm
income and the risk faced by farmers. The presence of these spillover effects means
that instrument design must take them into account. This can be seen in a number of
actually applied instruments in the importance attached to complimentary measures.
Taylor et al (1992) report on a simulation of economic incentives and other
mechanisms to offset non-point source pollution from agriculture in the Willamete
Valley (Oregon). The control measures examined included a direct tax on effluent
(leachate), input taxes, per acre standards on effluent, required use of no till drills on
small grains for seed and a ban on autumn fertiliser application. The main findings are
150
that no single policy option is optimal across all farm types and most farms can
undertake a limited amount of abatement at little cost.
Fox et al (1995) report on an economic analysis of soil conservation measures with
respect to off-site water quality. One of the main limitations on achieving effective
policies is in linking polluters to the damage actually imposed. This research
illustrates a means of using proxy criteria for identifying farmland which contributes
most to water quality damage.
C.3.2 Impacts of various control options on affected sectors
Considerable research has been undertaken into the effects of introducing economic
instruments for diffuse N and P on different sectors (farming sectors e.g. livestock
versus arable, fertiliser manufacturers etc.), the economy and world markets.
McCorriston and Sheldon (1996) examined the implications for the UK fertiliser
market of two nitrogen limitation policies: a nitrogen tax and a quota system. Using a
model of the UK fertiliser market a 10% and 25% tax on fertilisers and a 5% and 10%
reduction in fertiliser output (production) is simulated. In both cases the net effects on
welfare (of farmers, and the fertiliser industry) is negative. However under the quota
system the dominant fertiliser producers' profits rise at the expense of smaller
producers - indicating negative distributional impacts.
Liang et al (1998) report on an evaluation of the impact on national income, social
welfare and environmental quality of taxation schemes aimed at reducing commercial
fertiliser usage. Two taxation schemes (uniform tax and a regionally differentiated
tax) were examin ed through a Computable General Equilibrium Model. The overall
macroeconomic effects were found not to be significant. A 7% to 8% reduction in
fertiliser output would be associated with a 5% increase in fertiliser prices.
Taylor (1975) compared tradeable user rights (permits) for fertilisers with a fertiliser
tax in Illinois. The model indicates that the outcome of the two policies would be the
same, provided that non-fertiliser users did not purchase user rights. The study points
to the important differences between the two systems: the ability of non-users to
influence outcomes (higher under permits), the ease of adapting to changing economic
circumstances (higher under the tax), and the certainty over the outcome (higher
under the permit system).
Clunies-Ross (1993) reports on work by Dubgaard suggesting that achieving a 30%
reduction in nitrogen use could be achieved by a reduction in price support or a
nitrogen tax. The loss in farm income associated with the nitrogen tax is substantially
lower than with the reduction in price support (70 to 115 ECU.ha-1 for the tax
compared to 370 to 700 ECU.ha -1 for the price reduction). Other work reported is that
of von Urff whose assessment of taxing agricultural inputs for the reform of CAP
suggested that in Germa ny, while a halving of the price of cereals would make the
majority of production unprofitable a doubling of the price of fertilisers would still
allow production of cereals on "good" sites. As Clunies -Ross indicates, these different
results arise because a reduction in price support does not alter the relative price of
inputs while a tax on nitrogen does. Hence price support control options will mean a
cut back on all agricultural inputs (including labour and machinery) rather than just
151
nitrogen (with its possible substitution with labour for example). Other work by
Dubgaard is also discussed which shows how the income loss effects of a nitrogen tax
could be compensated with modest increases in commodity prices. However, in
practice this would mean allowing crop prices to vary with farm income, which would
be very difficult to implement.
Van der Veeren and Tol (1998) present a very detailed analysis of the benefits of
reallocating nitrate emission reductions (between farming sectors (e.g. arable, dairy),
countries and between point and diffuse sources) in the Rhine River Basin. Policies
which recognise the cost differences between sources and countries are found to be
25% cheaper than flat rate reductions. Table C.6 shows the winners (+) and losers (-)
from a more cost effective allocation.
Table C.6
Winners and losers from a cost effective allocation of abatement
Source
Win/lose
Arable clay farms
+
Arable sand farms
-
Dairy clay farms
+
Dairy sand farms
+
Pig breeding
+
Pig feeding
-
Sewage treatme nt
-
C.3.3 Integration with other policies
Other empirical research has focused on the difficulty of designing instruments that
are effective within the current policy framework - notably the Common Agricultural
Policy and other market support measures. This has manifested itself through research
into measures which align themselves with other objectives - voluntary direct
payment schemes and cross compliance.
Klienhaans et al (1997) discuss the influence of CAP reform on nitrogen surpluses
which are shown to be small primarily because CAP reform will not effect livestock
densities. A tax on fertilisers is also shown to have a higher effect (in terms of income
losses) on arable farmers than livestock farmers. A reimbursement system is required
to resolve this problem. An assessment of the impacts of the Nitrate Directive, versus
a nitrogen tax show that the tax would lead to lower farm income losses than the
Nitrate Directive.
Gunasekera et al (1992) examined the wider impacts (world commodity prices ,
production, trade etc.) of the imposition of a 50% and 75% tax on fertilisers in the
European Community. The effects were examined through a world agricultural trade
model. The effect on European agricultural production and world prices for key farm
commodities was estimated to be small, primarily because of the relatively small
impact of the taxes on overall producer support (subsidies). By comparison, a reform
of agricultural trade (the so-called Dunkel package) is shown to have a much larger
impact (5 to 10 times greater changes in agricultural prices) suggesting that a more
152
market orientated trade system for agriculture could offer the opportunity of meeting
both trade liberalisation, deregulation and environmental objectives.
C.3.4 Barriers to imple mentation
Much of the literature is concerned with explaining the apparent lack of progress on
applying economic instruments despite the frequent promotion by economists and
policy analysts. Transaction costs (the costs of putting a policy into practice) and the
strength of interest groups are frequently cited explanations. Many researchers have
suggested the fundamental difficulty with economic instruments for nutrients is that
the standard "economic" solution, an emission tax on leachate, will not work for
diffuse pollutants because of the high transaction costs of imposing such an
instrument at the emission stage (monitoring etc.) (see for example Romstad et al
1998). Instead policy makers are forced to focus on upstream points (application or
purchase, of fertilisers, production etc.). This means lower transaction costs but also
reduced precision and an increased likelihood "side-effects".
Easter (1993) discusses transaction and compliance costs together with program
effectiveness for a wide range of policy instruments. These included traditional US
approaches (cost-sharing, technical assistance and education), national and local bans
on specific chemicals, taxes, permits, land retirement, easements, performance and
practice standards and property rights/liability.
McCann and Easter (1998) estimated the transaction costs associated with a tax on
phosphate fertilisers, an education programme and two regulatory programmes. They
showed that the tax actually has substantially lower transaction costs than the
alternatives. Transaction costs are influenced by a number of factors including the
number of agents affected, resistance to the policy, amount of abatement required,
time frame and existing institutional arrangements. One of the reasons the transaction
costs of the phosphates tax may be lower, however, is that there is an existing tax on
fertilisers used to fund inspections and to cover the cost of accidental spills.
Lowe and Ward (1998) discuss the issue of current perceptions of the problem and the
interest groups involved and how alternative forms of regulation may affect different
parties. Regulation of farm pollution is a new problem and one which sits uneasily
with traditional views as farmers as guardians of the environment. The conclusion is
that any policy will need to be accompanied by a programme to educate and change
current values to reflect the problem at hand.
Asymmetry of information between the regulator and the regulated is a complicating
factor in all forms of regulation. Xepapadeas (1998) discusses the implication of
asymmetry in the case of a nitrogen tax. From the regulatory perspective mineral
emissions from a farm are unobservable as is the type of farmer (i.e. environmentally
conscious etc.). The observable parameters are input us age (e.g. purchases under a
tax). Xepapadeas shows that a scheme in which farmers are allowed to reveal their
characteristics (e.g. by choosing the tax schedule they face) may produce superior
153
outcomes. This principle is applied in practice in a number of countries where farmers
have a choice of a standard or actual assessment.
An important point made by Carpenter et al (1998) is the difference between
management scales and ecological scales. At the watershed level ecological scales are
from two to three decades, while management scales tend to be much shorter. This
mismatch in scales needs to be addressed in designing economic instruments. The
length of ecological time frames also means large uncertainties will be associated with
outcomes. Uncertainty about the benefits of management strategies reduces their
expected value and points to the potential benefits that can be realised by reducing
uncertainty.
C.4 Cost structures
A great deal of research has been undertaken into cost patterns faced by farms. Much
of this research has focused on defining optimal fertiliser application rates for
different farm types (e.g. Schlegel et al 1996) and in estimating demand elasticities.
Other research has examined the cost of alternative control options (best management
practices for agriculture, industrial and municipal treatment, etc.)
C.4.1 Elasticities of demand for fertiliser
Estimated demand (price) elasticities are useful statistics in discussing cost structures
since they demonstrate the likely reaction of farmers to price increases given the costs
of alternatives open to them. An important distinction needs to be made between short
and long run elasticities. In the short run some inputs are fixed (e.g. machinery) and
hence actions are limited. In the long run these restrictions disappear. The distinction
between a long and short run elasticity is frequently rather vague and in general there
is a poor understanding of how price changes effect technologies, for example by
stimulating research and development into more nitrogen efficient application
technologies (e.g. soil injection systems). However, the key point is that in the long
run farmers have more opportunities to respond to price increases (for example by
replacing existing machinery with more efficient machinery at the natural end of its
life).
The literature is unequivocal in pointing to the inelastic nature of fertiliser demand.
This is generally attributed to the potency of the product in generating yield
improvements (Easter 1993). Francis (1992) reports that fertiliser prices in the US
between 1977 and 1992 fluctuated over a large range (greater than 300%) without
significant changes in use patterns.
C.4.2 Abatement costs
Most of the literature on abatement costs concerns empirical (e.g. using farm level
data) comparison of alternative policy options (e.g. taxes versus regulations). Many
studies point to the apparent overuse of nitrogen fertiliser (above what is privately
optimal to the farmer). Trachtenberg and Ogg (1994) suggest that the rate of over use
154
in the US is approximately 24% to 32%. There is therefore potential for cost
beneficial reductions in certain circumstances which needs to be borne in mind when
interpreting cost data. Other research points to the wide variation of cost patterns
faced by polluters even within the same sector. Berentsen and Giesen (1998)
evaluated a range of instruments for managing nitrogen surpluses on Dutch livestock
farms finding that there was a wide variation in cost structures between farmers in this
sector (see also van Veeren and Tol 1998).
Abatement measures can be classified as either mitigation or avoidance. Mitigation
measures attempt to intervene between the pressure (fertiliser use) and the effect (e.g.
eutrophication) for example by reducing the dama ge per unit of fertiliser use.
Avoidance measures on the other hand are aimed at reducing the pressure itself. In
general examinations of abatement costs relate to both types of measures.
Table C.7 summarises reported abatement costs in a number of countries for different
site specific characteristics and policy options.
Table C.7
Nitrogen abatement cost estimates (agriculture)
Study
Abatement Cost
Metric
Romstad et al (1998) - 100% tax on
9 to 16
$ per kg of avoided
fertiliser
leaching. Private costs.
Romstad et al (1998) - catch crops
1.5 to 4.5
$ per kg of avoided
50% cover
leaching. Private costs.
Romstad et al (1998) - combined
4.5 to 9
$ per kg of avoided
catch crop and tax
leaching. Private costs.
Klienhanss et al (1997) - Nitrates
3.6
$ per kg of reduced
Directive
nitrogen surplus
Van Veeren and Tol (1998)
1.5 to 7.5
$ per kg of abatement
Klienhanss et al (1997) - nitrogen
1.5
$ per kg of reduced
levy
nitrogen surplus
Crutchfield et al (1994)
1.5 to 10.5
$ per kg of avoided in
receiving water load
A wide range of costs are in evidence reflecting varying local conditions. Comparison
is also made difficult by the way in which abatement costs are presented - a variety of
metrics, avoided leaching, edge of stream and receiving water load. In general
agricultural abatement costs are lower than for point sources. For example, van
Veeren and Tol (1998) point sources 11 to 16 $ per kg of abatement, Crutchfield et al
(1994) $10 to $21.kg-1, and Bundi (1994) $10 to $16.kg-1.
For phosphorus Sc hleich and White (1997) provide cost estimates for various
measures to reduce phosphorus from major sources exported to Lower Green Bay,
Wisconsin. Cost estimates are reproduced below (Tables C.8 and C.9).
155
Table C.8
Agricultural and other abatement costs for phosphorus
Costs ($) to reduce 1 kg of phosphorus
Sources
Low
Average
High
Agriculture
3
16
42
Municipal/industrial sources
47
100
820
Construction run-off
320
480
1020
Urban storm run off
1060
1260
2420
Table C.9
Phosphorus abatement cost estimates - agriculture
Study
Abatement Cost
Metric
Crutchfield et al (1994)
22 to 95
$ per kg of avoided receiving water load
Heatwole et al (1987)
7.5 to 9
$ per kg of reduced edge of stream load
Bann and Berbee (1989)
50
$ per kg of avoided receiving water load
Some authors point to the increasing marginal costs as targets are approached
(Schliech et al 1996). In the Lower Green Bay example lowering the target by 33%
results in an increased cost of 75%.
C.4.3 Damage costs/benefits
A full understanding of the potential benefits of economic instruments needs to
recognise the potential benefits and avoided damage costs of controlling diffuse
sources of N and P. Le Goffe (1995) discusses the potential benefits of improvements
in coastal water quality. The Brest harbour was chosen as a pilot site in an EC
research programme. A contingent valuation survey was used to identify the value
placed by French households on preservation of the ecosystem against eutrophication.
FF120 ($18) on avera ge was the `willingness to pay' (WTP) per household in the
area. These results may have been influenced by media reports of the enrichment of
waters.
Magnussen (1992 reported in Le Goffe 1995) used a model to estimate the value of a
50% reduction in the output of nutrients, nitrogen and phosphorus, to the North Sea.
The reported WTP was 1000FF ($150) per household in 1991. Bockstael (1989,
reported in Le Goffe 1995) undertook a travel cost evaluation estimated a WTP for
"swimable water" as a result of lower nitrogen and phosphorus concentrations
equivalent to 350FF ($500) in 1987.
Gren et al (1997) report on a cost benefit analysis of nutrient reductions to the Baltic
Sea finding that the benefits of a 50% reduction in the load of nitrogen and
phosphorus are approximately equivalent to the associated costs. All Baltic Sea
countries except for Lithuania, Estonia, Latvia and Poland would receive net gains
156
from a cost effective abatement programme involving changed agricultural prices,
construction of sewage treatment works and wetland restoration.
Van Vuuren et al (1997) report on an evaluation of the social returns from agricultural
practices aimed at water quality improvements in an Ontario watershed. The main
findings were that the water quality improvements were limited because of the
remaining burden from non-agricultural sources and that some measures produced
positive on farm returns.
C.5 Economic Instruments for Nutrient Control within the
Black Sea Region
C.5.1 Bulgaria
In general the Government intends to reformulate environmental and water legislation
to provide a framework in turn with the needs of a market oriented economy. Action
recently taken includes the passing of the 1991 Environmental Protection Act (EPA),
its amendment in 1992. Act establishes the principles of user charges and pollution
charges. "The person polluting the environment and using natural resources shall pay
charges for the contamination and usage of these resources". According to the
Ordinance for economic sanctions for air, water and soil pollution No24 from 1993,
fines and sanctions are imposed for pollution exceeding the admissible limits. The
sanctions are distributed according to the EPA in the National fund 70% and the
municipal funds 30% for environmental protection and may be used only for financial
support of environmental protection activities.
The study on the Introduction of Phosphate Free Detergents in the Bulgarian part of
Danube River Basin has been carried out under the Danube Applied Research
Programme in 1996. The objective of the project was to support Bulgaria to eliminate
phosphorous (P) from dete rgents, used in households and in industry, as soon as
technically possible and economically justified. One of the findings of the study is
that the low living standard and economical background is limiting the use of
detergents in the households. Disturbed market influences the industry. Low
households income is related to low consumption of granulated materials and high
soap application (very often home-made in the agricultural areas and small towns).
On the other hand new market conditions make possible import of detergents from
Western Europe as well as from Rumania, Turkey, Greece, Check Republic etc.
There is no legislation in Bulgaria dealing with eco-labeling of products. Legal
documents are currently being drafted for packaging signs on environmentally clean
products and financial support of its production for improving the access of Bulgarian
producers to national and international markets. In relation to the detergents, work is
undertaken for harmonization with European Commission Decision of 28 May 1999,
establishing the ecological criteria for the award of the Community eco-label to
detergents for dishwashers (1999/427/EC) and European Commission Decision of 10
June 1999, establishing the ecological criteria for the award of the Community eco-
label to laundry detergents (1999/476/EC)
157
C.5.2 Georgia
Georgian Tax Code with respect to nutrients regulates the following economic
instruments:
� Taxation. There exist limits for the discharge. The limit is the total defined
amount of a harmful substance for discharge for a taxpayer for each calendar
quarter. The limits are defined by the taxpayers themselves and approved by
the Ministry of Environment. The Georgian Tax Code is a list of fixed taxes
put on each ton of discharged harmful substance, not exceeding the defined
limit. Under the Tax Code the established taxes are as follows:
- Total nitrogen
- 390 Lari per ton ($200);
- Ammonia nitrogen - 390 Lari per ton ($200);
- Phosphates
- 156 Lari per ton (�80);
- Phosphorus
- 390 Lari per ton ($200).
The amount of money to be paid by a taxpayer is calculated on the basis of existing
ecological state in specific region (water body). Established tax is multiplied by the
relevant ecological state factor. For the Black Sea coastal line (category of especially
polluted water bodies) ecological state factor is 1,5.
� Liability (fines). Under the Georgian Tax Code the fines for the discharge of
harmful substances exceeding the limits are defined equalling 5 times as much
as the established taxes.
� Eco-labelling - there exists only labelling. Labelling is defined by the
Georgian Law on Pesticides and Agrochemicals.
C.5.3 Romania
The taxation system is applied by National Company "Romanian Water" for water
abstraction/supply (raw water) and waste water discharges. There is not as yet any
regulation concerning on-farm organic manure surpluses/ inorganic nutrient balances.
Economic Instruments for nutrient control which are used or being considered in
Romania include:
� Direct payments: made to wastewater treatment companies (by industry etc.).
� Cost sharing is specific for the industrial effluents when the polluter should
contribute by direct payment to the WWTP.
� Tradeable rights � currently promoted by MWFEP for implementation in 2002
after the vulnerability classification of the rivers. A special methodology for
nutrient application in agriculture (MWFEP/ MAF) it is expected to be carried
out till 2002.
158
� Cross compliance � under the Water Law (new version), despite the use of
penalties, there is provision for encouranging a reduction of pollution
(including nutrients) without regulatory instruments.
� Concerning the phosphorous free detergents, the Ministry of Industry and
Trade are considering to promote a maximum acceptable level (not only the
biodegradability) of P (till the end of 2003).
C.5.4 Russia
The economic instruments targeted directly at nutrient control do not exist in Russia.
The environmental law incorporates economic instruments for the purpose of the
environment protection as a whole.
The purpose of the economic instruments are for: (i) environmental measures
planning and financing; (ii) establishment of limits for natural resources use,
emissions and discharges of pollutants to the environment, wastes disposal; (iii)
establishment of payment normatives and payment rates for the use of natural
resources; (iv) pollutant emissions/discharges; (v) wastes disposal and other types of
harmful impact; (vi) favorable/reduced rates, credits, tax exemption and other
privileges for enterprises/organisations; (vii) compensation of the damage caused to
the environment and people's health.
The economic instruments include:
� payment for the natural resources (soil, mineral resources, water, forests, flora
and fauna, recreational and other resources), which is charged for the right to
use the natural resources within the set limits; for irrational and over the limits
use of the natural resources; the raised finances are spent for the natural
resources reproduction and protection;
� payment for the environment pollution and other types of impacts, which is
charged for emissions/discharges of pollutants, wastes disposal within the set
limits; for emissions/discharges of pollutants and wastes disposal over the
established limits;
� ecological funds (federal, regional, local, publis), which are non�budgetary
and state. They are established in order to implement urgent environmental
measures, to compensate the damage/losses caused to the environment. They
are formed by the financial resources transferred by enterprises/organisations
and citizens, including payment for emissions/discharges/wastes disposal,
compensation money, fines/liabilities for violation of environmental
laws/regulations, etc. Ecological funds financial resources are distributed as
follows: 60% � for implementation of local environmental measures, 30% �
for implementation of regional environmental activities, and 10% � for
implementation of federal envir onmental activities. It is prohibited to spend
the money of the environmental funds for the purposes not related to the
environmental activities. Public ecological funds are formed by the money of
citizens, voluntary payments of public organisations and from other sources;
159
they are established by public organisations, trade unions; their financial
resources are spent exclusively for the environment protection.
� Environmental insurance. In the Russian Federation there are two types �
voluntary and obligatory � of the environmental insurance for enterprises,
organisations, citizens and their properties in case of ecological accidents,
emergencies, hazards, catastrophe and disaster.
� Economic incentives for the environment rational use and protection are as
follows: (i) tax exemptions/reduced rates and other privileges for
enterprises/organisations when they introduce low/non�waste technologies,
use secondary resources; implement other effective environmental measures;
(ii) tax exemption for ecological funds; (iii) stimulating prices and bonus for
ecologically clean products; (iv) special taxes for ecologically harmful
products; (v) favorable credit rates for enterprises and organisations,
independent on their ownership, that implement effective environmental
protection measures; (vi) partial transfer of the financial resources of the
ecological funds (interest rate loans) to enterprises/organisations for
implementation of emissions/discharges reduction measures.
According to the Russian legislation the subjects of the Russian Federation have the
right to establish other economic incentives for the environment protection.
C.5.5 Turkey
Among the most common charges, which are relevant to nutrient control, are (i) those
targeted for water and waste facilities in ports and sewerage discharge and (ii) the
`Cleansing Tax'. The Cleansing Tax could be singled out as the most significant
economic instrument in terms of its nationwide use and awareness level. It is collected
at the local level to be used primarily for solid waste expenditures of municipalities.
With respect to eco-labelling, regulations are in force as detailed in the `Production of
Plant and Animal Products by Utilizing Ecological Methods' (date of issue: 18
December 1994). The wider aim of this document is to produce, through eco-
labelling, ecological friendly agricultural products in order to protect the ecological
balance or, where necessary, redevelop the ecological balance. The regulations
specifically aim to increase the demand for these products and to supply healthy and
high quality eco-products to the consumers. To this end the document sets forth the
principles to promote production processing and marketing of plant and animal
products by practicing ecological methods. The plant products, which are
cultivated/produced by making use of ecological methods, utilise organic fertilizers,
manure from ecologically grown animals and/or organic or mineral fertilizers in their
natural forms which are approved by the control authority are labelled to be
differentiated from other products. The regulations apply an incentive not to use
synthetic fertilizers in agricultural practices.
C.5.6 Ukraine
No data available at the time of writing this report
References for Appendix C
160
Adler, R.W. (1994) Re-authorising the Clean Water Act: Looking to tangible values,
Water Resources Bulletin 30, 799-807.
Anon (1991) Danes nutrient battle depends on agricultural action, Water Quality
International, 3, 44-47.
Bann, P.J.A. and Berbee, R.P.M. (1989) Diffuse Bromen, H20, 22(6), 185.
Berentsen, P.B.M. and Giesen G.W.J. (1998) Governmental policy options for
decreasing nitrogen and phosphate losses on Dutch dairy farms. In E. Romstad, J.
Simonsen and A. Vatn (eds) Controlling Mineral Emissions in European Agriculture:
Economics, Policies and the Environment, pp 175-192. CAB International,
Wallingford.
Boggess, W.G., Flaig, E.G. and Fonyo, C.M. (1993) Florida's experience with
managing nonpoint-source phosphorus run-off into Lake Okeechobee. In C.S. Russel
and J.F. Shogren (Eds) Theory, Modelling and Experience in the Management of Non
Point-Source Pollution , pp 231-268. Kluwer Academic Publishers.
Braden, J.B. and Segerson, K. (1993) Information problems in the design of non point
pollution policy. In C.S. Russel and J.F. Shogren (1993) Theory, Modelling and
Experience in the Management of Non Point-Source Pollution, pp 1 -36. Kluwer
Academic Publishers.
Carpenter, S.R., Bolgrien, D., Lathrop, R.C., Stow, C.A., Reed, T. and Wilson, M.A.
(1998) Ecological and economic analysis of lake eutrophication by non-point
pollution, Australian Journal of Ecology, 23, 68-79.
Clunies-Ross, T. (1993) Taxing nitrogen fertilisers, The Ecologist, 23, 13-17.
Crutchfield, S.R., Letson, D. and Malik, A.S. (1994) Feasibility of point-nonpoint
source trading for managing agricultural pollutant loadings to coastal waters, Water
Resources Research , 30, 2825-2836.
Curry, N. and Stucki, E. (1997) Swiss Agricultural policy and the environment. An
example for the rest of Europe to follow? Journal of Environmental Management and
Planning, 40(4), 465-482.
Easter, K.W. (1993) Differences in the transaction costs of strategies to control
agricultural offsite and undersite damages. In C.S. Russel and J.F. Shogren (eds)
Theory, Modelling and Experience in the Management of Non Point-Source Pollution ,
pp 37-68. Kluwer Academic Publishers, The Netherlands.
Fox, G., Umali, G. and Dickinson, T. (1995) An economic analysis of targeting soil
conservation measures with respect to offsite water quality, Canadian Journal of
Agricultural Economics, 43, 105-108.
Francis, D.D. (1992) Control mechanisms to reduce fertiliser nitrogen movement into
groundwater, Journal of Soil and Water Conservation, Nov-Dec, 444-448.
Frederiksen, B.S. (1994) National responses to the EC nitrate policy, Journal of
Environmental Management and Planning , 38, 253-263.
Gren, I.M., Soderqvist, T. and Wulff, F. (1997) Nutrient reductions to the Baltic Sea:
ecology, costs and benefits, Journal of Environmental Management, 51(2), 123-143.
Gunasekera, H.D.B.H., Rodriguez, G.R. and Andrews, N.P.(1992) World market
implications of taxing fertiliser use in EC agriculture, Agriculture and Resources
Quarterly, 4(3), 389-396.
Hansen, L.G. (1997) An incentive-based policy for nutrient removal after emission. In
E. Romstad, J. Simonsen and A. Vatn (eds) Controlling Mineral Emissions in
European Agriculture: Economics, Policies and the Environment, pp 121-137. CAB
International, Wallingford.
161
Heatwole, C.D., Bottcher, A.B. and Baldwin, L.B. (1987) Modelling cost
effectiveness of agricultural nonpoint pollution abatement programs on two Florida
basins, Water Resources Bulletin , 23, 127.
Helfand, G.E. and Archibald, S.O. (1990) California's Proposition 65: a new
regulatory trend? In J. Baden and S.B. Lovejoy (eds) Agriculture and Water Quality:
International Perspectives, pp 147-168. Lynne Riemer, London.
Hodge, I. (1997) Applying land use permits for the control of mineral emissions. In E.
Romstad, J. Simonsen and A. Vatn (eds) Controlling Mineral Emissions in European
Agriculture: Economics, Policies and the Environment, pp 105-120. CAB
International, Wallingford.
Klienhanss, W., Becker, H. and Schleef, K.H. (1997) Impacts of agrienvironmental
policy measures on nitrogen emissions from agriculture. In E. Romstad, J. Simonsen
and A. Vatn (eds) Controlling Mineral Emissions in European Agriculture:
Economics, Policies and the Environment. CAB International, Wallingford.
Kozloff, K., Taff, S.J. and Wang, Y. (1992) Micro-targeting of acquisition cropping
rights, Water Resources Research, 28(3), 623-628.
Kumm, K.I. (1990) Incentive policies in Sweden. In J. Baden and S.B. Lovejoy (eds)
Agriculture and Water Quality: International Perspectives, pp 105-116. Lynne
Riemer, London.
Le Goffe, P. (1995) The benefits of improvements in coastal water quality - a
contingent approach, Journal of Environmental Management, 45(4), 305-317.
Liang, C., Lovejoy, S.B. and Lee, J.G. (1998) Green taxes: impacts on national
income, social welfare and environmental quality. Department of Community
Deve lopment and Applied Economics, University of Vermont, Burlington, Vermont.
Lichtenberg, E., Strand, I.E.R. and Lessley, W.V. (1993) Subsidising agricultural
nonpoint-source pollution control - targeting cost sharing and technical assistance. In
C.S. Russel and J.F. Shogren (eds) Theory, Modelling and Experience in the
Management of Non Point-Source Pollution. Kluwer Academic Publishers.
Lowe, P. and Ward, N. (1998) The moral authority of regulation: the case of
agricultural pollution. In E. Romstad, J. Simonsen and A. Vatn (eds) Controlling
Mineral Emissions in European Agriculture: Economics, Policies and the
Environment. CAB International, Wallingford.
McCann, L. and Easter, K.W. (1998) Estimating transaction costs of alternative
policies to reduce phosphorus pollution in the Minnesota River. Staff Paper Series
(P98-7). University of Minnesota.
McCorriston, S, and Sheldon, I.M. (1989) Welfare implications of nitrogen limitation
policies, Journal of Agricultural Economics, 40(2), 143-151.
Morse, G.K., Lester , J.N. and Perry, R. (1993) The Economic and Environmental
Impact of Phosphorus Removal from Wastewater in the European Community. Selper
Publications.
Moxey, A. and White, B. (1994) Efficient compliance with agricultural nitrate
pollution standards, Journal of Agricultural Economics, 45(1), 27-37.
OECD (1995) Environmental taxes in OECD countries. Organisation for Economic
Co-Operation and Development, Paris.
Randhir, T.O. and Lee, G. (1997) Economic and water quality impacts of reducing
nitrogen and pesticide use in agriculture, Agricultural and Resource Economics
Review, 20(1), 39-51.
Reichelderfer, K.H. (1990) National agro-environmental incentive programmes. In J.
Baden and S.B. Lovejoy (eds) Agriculture and Water Quality: International
Perspectives, pp 131-146. Lynne Riemer, London.
162
Romstad, E., Vatn, A., Bakken, L.R. and Batterweg, P. (1998) Economics-ecology
modelling: the case of nitrogen. In E. Romstad, J. Simonsen and A. Vatn (eds)
Controlling Mineral Emissions in European Agriculture: Economics, Policies and the
Environment, pp 225-248. CAB International, Wallingford.
Scheele, M. (1997) The decomposition approach: spatially differentiated analysis and
implementation of environmental strategies. In: E. Romstad, J. Simonsen and Vatn,
A. (eds) Controlling Mineral Emissions in European Agriculture: Economics,
Policies and the Environment, pp 41-58. CAB International, Wallingford.
Schlegel, A.J., Dhuyvetter, K.C. and Havlin, J.L. (1996) Economic and environmental
impacts of long-term nitrogen and phosphorus fertilisation, Journal of Production
Agriculture, 9(1), 114-118.
Schleich, J. and White, D. (1997) Cost minimisation of nutrient reduction in
watershed management using linear programming, Journal of the American Water
Resources Association, 33(1), 135-142.
Schleich, J., White, D. and Stephenson, K. (1996) Cost implications in achieving
alternative water quality targets, Water Resources Research, 32(9), 2879-2884.
Schou, J.S. (1997) Implementation of nitrate policies in Denmark. In: F. Brouwer and
Klienhass, W. (eds) Implementation of Nitrate Policies in Europe.
Wissenschaftsverlag Vauk, Kiel, Republic of Germany.
SEPA (1997) Environmental taxes in Sweden - economic instruments of
environmental policy. Swedish Environmental Protection Agency, Stockholm.
Shortle, J.S. (1990) The allocative efficiency of water pollution abatement cost
comparisons, Water Resources Research , 26(5), 793-797.
Shortle, J.S. and Laughland, A. (1994) Impacts of taxes to reduce agrochemical use
when farm policy is endogenous, Journal of Agricultural Economics, 45(1), 3-14.
Taylor, C.R., Adams, R.M. and Miler, S.F. (1975) A regional market for rights to use
fertiliser, Journal of Environmental Economics and Management, 2, 7-17.
Taylor, M.L. et al (1992) Farm level responses to agricultural effluent control
strategies - the case of Willamette Valley, Journal of Agricultural and Resource
Economics, 17(1), 173-185.
Trachtenberg, E. and Ogg, C, (1994) Potential for reducing nitrogen pollution through
improved agronomic practices, Water Resources Bulletin, 30(6), 1109-1117.
USEPA (1996) Draft framework for watershed based trading. Report No. EPA 800-R-
96-001.
van der Veeren, R.J.H.M. and Tol, R.S.J. (1998) Benefits for a reallocation of nitrate
emission reductions in the Rhine River Basin. Institute for Environmental Studies,
Free University of Amsterdam. Report No. D98-07.
van Gijseghem, D.E.L.J. (1997) Implementation of nitrate policies in Flanders. In:
F.E. Brouwer and S.W. Klienhens (eds) The Implementation of Nitrate Policies in
Europe, pp 135-148. Wissenschaftsverlag Vauk, Kiel.
van Vuuren, W., Giraldez, J.C. and Stonehouse, D.P. (1997) The social returns of
agricultural practices for promoting water quality improvement, Canadian Journal of
Agricultural Economics, 45(3), 219-234.
Versmersch, D. and Raould, N. (1997) Economic perspectives for nitrate policy in
Brittany. In: F.E. Brouwer and S.W. Klienhens (eds) The Implementation of Nitrate
Policies in Europe, pp 149-160. Wissenschaftsverlag Vauk, Kiel.
Xepapadeas, A. (1998) Regulation of mineral emissions under asymmetric
information. In E. Romstad, J. Simonsen and A. Vatn (eds) Controlling Mineral
Emissions in European Agriculture: Economics, Policies and the Environment, pp 89-
104. CAB International, Wallingford.
163
Annex 11
FINAL REPORT
SUPPORTING PUBLIC INVOLVEMENT IN NUTRIENT
CONTROL
Summary
Following the Terms of Reference, all tasks set in the PDF -B were fully
completed and the following outcomes produced:
(1)
Call for Project Proposals to the GEF/BSEP Small Grants
Programme desi gned and disseminated broadly among coastal
NGOs in Bulgaria, Georgia, Russia, Romania, Turkey and
Ukraine (see Annex II);
(2)
48 NGO project proposals collected and further evaluated
against set criteria by an independent expert committee (see
Annex III);
(3)
29 NGO projects recommended for full or partial GEF support during
the first two years of the new GEF Black Sea Programme (Annex I);
(4)
Participating NGOs informed about the results of project
evaluations;
(5)
Written contribution to the Project Brief prepared.
1. Background information
1.1. Black Sea NGO Forum
The previous GEF Black Sea Programme has recognized the importance of including
the coastal non-governmental organizations (NGOs) into the regional efforts of
protecting the Black Sea. In 1994, with the GEF/BSEP support, the Black Sea
Environmental NGO Forum was set up as a mechanism for local NGOs to exchange
their experiences, implement joint projects and participate (as observers) at
intergovernmental Black Sea meetings. In 1997/98, the Black Sea NGO Forum jointly
with the Field Studies Council (UK) organized a series of international and national
training workshops to improve the capacity of coastal NGOs. That project was
successful and widened the circle of NGOs involved in the GEF/BSEP Black Sea
Programme. Another successful NGO Forum initiative was the Black Sea Action
Day. It was originally proposed by the NGOs as a celebration of the signing of the
Black Sea Action Plan in 1996. Until 1998, this initiative was supported by BSEP.
Afterwards, the local communities continued to celebrate the Black Sea Day, raising
their own funds for public activities.
Although it no longer functions as an organization, the NGO Forum provides
important lessons. First, it revealed that there are genuine citizen groups all along the
coast, working to restore and protect the Black Sea. These groups are the basis for the
development of the civil society in this region and as such they need international
recognition and support. Second, it showed that international NGO netwoking in the
Black Sea region is poorly developed and requires supportive coordination.
1.2. Black Sea Environmental NGO Network
164
Although most Black Sea NGOs are primarily concerned with very local issues, they
recognize the need for a regiona l information and coordination mechanism. When in
1998 it became apparent that the Black Sea NGO Forum was not able to sustain itself
without the GEF/BSEP support, a number of Black Sea NGOs (some members of the
previous Forum), took the opportunity of a new source of funding (NOVIB) to form a
Black Sea Environmental NGO Network (BSNN). Today, the BSNN is a registered
international NGO based in Varna, Bulgaria. It provides regular information and
assistance to its NGO members through international meetings, its own website and a
newsletter. It also serves as a lobbying mechanism for coastal NGOs on critical Black
Sea issues (particularly in Bulgaria).
In a short time, the BSNN has made its presence noticeable in the Black Sea region.
Its work (especially a functioning website and a newsletter) is highly appreciated by
the coastal Black Sea NGOs, as well as by NGOs from other regions. Sustainability of
the BSNN depends largely on outside support because the coastal NGOs are not in a
position to pay high fees. With GEF support in this new phase of the Black Sea
Programme, the BSNN could be strengthened and further developed (Section 1.3).
1.3. Support to local NGOs through Small Grants Programmes
In the previous phase of the GEF Black Sea Programme, local Black Sea NGO
initiatives were supported through Small Grants Programmes, one in 1995 and the
other one in 1997/98. The main focus of these programmes was on raising public
awareness of the Black Sea issues, and on environmental education. Participating
NGOs designed interesting projects and were able to deliver good quality products.
Because the previous experience with Small Grants was positive, this approach was
used again in the preparatory stage of this subcomponent (Section 2).
2. New GEF Small Grants
Like the rest of the new GEF Black Sea Programme, the Public Information and
Involvement Subcomponent focuses on minimizing eutrophication in the Black Sea.
In designing this Subcomponent, it was decided to first identify whether the local
NGOs were interested and prepared to use the GEF support in local activities,
contributing to nutrient reduction in the Black Sea. A "Call for Project Proposals" was
circulated among the coastal NGOs in all 6 countries, which defined clear funding
priorities:
� Restoration and conservation of wetlands
� Promotion of organic (chemical-free) agriculture and farming
� Introduction of low-technology waste water treatment techniques in small
coastal communities
� Promotion of phosphate-free detergents
� Production of visual educational materials for schools, local authorities
and general public on:
(1) the ecological role of wetlands and the need for their preservation;
(2) techniques and importance of water conservation;
(3) problems and solutions (low-technology) of wastewater treatment.
In total, 48 NGO proposals were submitted. They were evaluated by a committee,
including: (1) an expert from the Regional Environmental Center for Central and
165
Eastern Europe, (2) a WWF expert, and (3) a Tacis Black Sea Programme expert. In
the evalua tion process, the NGO proposals were prioritised as "High," "Medium," and
"Low." The first two categories of proposals will be included in the Project Brief for
GEF funding. The "Low" priority proposals will not be considered for funding at this
stage. The full table with evaluated proposals is included with this report.
3. Conclusions
Environmental protection of the Black Sea depends not only on international
agreements, but also on the daily actions of the coastal population. The PDF-B
provided support to develop a portfolio of small public initiatives contributing to
nutrient reduction in the Black Sea. These were submitted, evaluated and prioritised
through a competitive process including peer review. Selected NGO proposals are
directed at minimising eutrophication in the Black Sea through: (1) restoration of
wetlands (Ukraine, Russia, Moldova), (2) promotion of cost-effective water treatment
facilities (Ukraine), (3) constructed wetlands (Bulgaria), (4) development of organic
farming (Georgia, Bulgaria), (5) production of educational materials for schools and
general public (Bulgaria, Romania, Russia, Turkey, Ukraine), (6) public awareness
and involvement campaigns (Turkey, Romania). Based on the outcome of these
initiatives, a second tranche of small projects is proposed after a two-year period.
Project implementation will be monitored from the PIU. Additionally activities to
strengthen the regional network of NGOs are included.
166
Annex I.
GEF/BSEP Small Grants Evaluation Results
Table 1. Black Sea NGO Projects proposed for funding
Country
Requeste
Suggeste
Organization
Project Name
Duratio
d from
d GEF
Priority 3
n
GEF
contribu -
(USD)4
tion
(USD)
UKRAINE
Medium
Odessa
The Revival of
30
19,939*
10,000
Department of
the Dniester
months
the Socio -
mouth regio n
ecological
Union
Medium
Fund of Natural
Series of video
24
20,100*
15,000
Sciences and
films "Wetlands
months
Ecology
of the Ukrainian
(Odessa)
Black Sea
Region"
Medium
Ecological Club
"Clean water,
3
1,750*
1,750
"The Seventh
green forests for
months
Continent"
our children"
(Bolgrad)
Medium
INECO � South
Promote Cost-
18
13,610
10,000
Branch
effective water
months
treatment
facilities for
small coastal
communities in
Ukraine
Medium
Youth
Education on
10
7,700
5,000
Environmental
sustainable usage
months
Society GAIA
of water
preservation and
eutrophication in
Ukraine
Medium
Ecostyle
Show-bench
24
5,000
5,000
(Crimea)
"Living Water"
months
Medium
3 NGO
"Stop human-
24
65,000
Maximum
selected
proposals
made
months
20,000
projects,
coordinated by
eutrophication of
must be
Dr. Sergey
the Black Sea -- a
further
Khvorov
role for
develope
everyone"
d
TURKEY
The Black Sea
Raising the
24
15,000*
11,000
High
Environmentalis
public awareness
months
t
on the effects of
3 When evaluated, all submitted projects were prioritized into "Low," "Medium," and "High," with the
last two categories being recommended for GEF funding at this stage.
4 Note: A star mark (*) after the amount requested from the GEF means that it is smaller than the total
project budget. The absence of such mark means that the project budget does not reflect any cost-
sharing.
167
(Trabzon)
pollution on
environment,
human health and
wildlife in
Trabzon
168
Medium
Turkish
Watching out the
30
33,200*
15,000
to High
Environmental
Black Sea Coastal months
and Woodland
Hot Spots
Protection
Society,
Istanbul
Medium
Research
Determination of
28
7,250*
5,000
Association of
Polluting factors
months
Rural
of rural
Environment
environmental
and Forestry,
problems on
Ankara
Black Sea, and
education of local
people
Medium
Underwater
Public Awareness 19
16,550
12,000
Research
and education
months
Society, Ankara
project on
wetland ecology
RUSSIA
Medium
Krasnodar
Clever Dacha
2001- 03
18,100*
15,000
to High
Regional NGO
(Farming) for the
Ecourse
Environment
Medium
Green Lungs
"Let's Keep for
30
17,995*
17,995
Novorossiysk
Future"
months
Medium-
Environmental
Wetland
11
9,850*
8,000
High
Center of Sochi
Education for
months
Children
Medium-
Sochi Branch of
Restoration of
24
9,580*
9,580
High
the Russian
Imeretinskaya
months
Geographic
Wetland on the
Society
Russian Coast of
the Black Sea
Medium
Sports and
"The Green Filter
24
22,092*
10,000
Health Society
for the polluted
months
"Sailing
drains"
Academy
ROMANIA
High
Mare Nostrum
Romanian
24
21,659*
21,659
Coastal
months
Watershed
Voluntary
Programme -- an
organizational
framework to
provide
environmental
education,
training and
direct assistance
to rura l and urban
residents for
controlling non-
point source
pollution
Medium-
G.E.S.S. - - The
Black Sea Public
24
43,030*
20,000
High on
Group for
Awareness
months
provision Underwater and
Project
of scaling Speleological
169
down to
Exploration
20,000
170
Medium-
Prietenii
Water is Life --
24
15,578*
15,578
High
Pamantului
production of
months
(Earth Friends)
visual
educational
materials for
schools, local
authorities and
the general public
Medium-
UNESCO Pro
Waters and
21
14,625*
10,000
High
Natura --
Wetlands
months
Association for
National
Action in
Information
Protected Areas
Internet NGO
Website
GEORGIA
Medium
Biological
Organic farming
4
6,728
5,000
Farming
for farmers, local
months
Association
authorities and
ELKANA
other
stakeholders in
Western Georgia
(Black Sea Coast)
Medium
Association
Weekly radio
12
13,030
10,000
Green Wave
programme "All
months
About the Black
Sea"
BULGARIA
High
Black Sea
Study and
24
12,870
12,870
Coastal
Promotion of
months
Association,
Constructed
Varna
Wetlands for
Wastewater
Treatment in
Small Coastal
Communities in
Bulgaria
Medium-
Bulgarian
"Let's save the
24
9,130
5,000
Low
Democratic
wetlands of
months
Youth
Bulgarian Black
Sea coast"
(educational film)
Medium
ECOFARM
Organic Farming
3 years
25,000
25,000
Association
in the Catchment
Area of the
Bourgas Bay
MOLDOVA
Medium
National
Protection and
17
8,000
8,000
Association
Rehabilitation of
months
Water Science
the Wetland Area
(Kishinev)
dislocated in the
zoneof the lakes
Beleu and Manta
on the river Prut
in the Black Sea
Basin
171
Table 2 Projects not selected (low priority projects)
Country
Amount
Organization
Project Name
Duration requeste
Priority
d from
5
GEF
(USD)6
UKRAINE
Low
Ecological
Creation, support and
24 months
7,360*
Center "Delta"
updating of the Internet
(Vilkovo))
website "Ecology of
Odessa Area"
Low
Ecological Club
Preparation, edition and
9 months
8,225*
"Danube"
introduction in target
groups of a text -book
"Rare and endangered
birds of the Ukrainian
Black Sea coastal areas"
Low
Yalta Student
Visual materials of
2,5 years
15,550
Scientific
Crimean wetlands and
Society
wastewater treatment
Low
Research Center
Monitoring of the
36 months
25,000*
"Noosphera"
eutrophication's level in
(Odessa)
the Black Sea zone under
the Danube water influence
Low
Youth
Towards Sustainability in
24 months
24, 850*
Environmental
the Black Sea basin:
League of
Reduction of Pollution of
Prydnyprovya,
Dnipro River at the Local
Dnipropetrovsk
Level
Low
Youth
The Territory of the
7 months
22,490*
Ecological
Ukraine is the Black Sea
Center
Basin
Sumscheena,
Sumy
Low
Regional NGO
Reduction of
24 months
21,958*
"Green
eutrophication influence of
Defence"
the small rivers and limans
of the Odessa region....
N/A
Black Sea
Popular Science Book
18 months
18, 450*
Biosphere
"The Wetlands birds of the
Reserve
Black Sea Biosphere
Reserve"
Low
Informal
1. To identify ecological
educational and
consequences of excessive
reserach circle
wet soil remediat ion...
E c o-soil
2. Water pollution and
(National
eutrophication in the
Agricultural
Dnipro....
University of
Ukraine)
TURKEY
5 When evaluated, all submitted projects were prioritized into "Low," "Medium," and "High," with the
last two categories being recommended for GEF funding at this stage.
6 Note: A star mark (*) after the amount requested from the GEF means that it is smaller than the total
project budget. The absence of such mark means that the project budget does not reflect any cost-
sharing.
172
Incomple
Environmental
A biological refining
1-2 years
24,000*
t
Protection
system for the wastewater
proposal
Association of
of Bahcelievler District in
Zonguldak
Zonguldak
RUSSIA
Medium-
NGO
Formation of Public
24 months
17,300*
Low
Ecological-
Opinion of the Rostov
Recreation
Region Population
Consortium
intended to conservation
ERCONS
and preservation of the
Don River delta and the
Sea of Azov Wetlands
Low
Novorossiysk
Sudzhuk Lagoon
6 months
7,700*
Public
(wetlands) should be clear
Orga nization of
Study and
Protection of
Biological
variety of Flora
and Fauna
Low
Social -Cultural
Developing of proposals
24 months
50,000*
Center of
for the conservation of
Rostov Oblast,
wetlands, coastal lakes,
Ecopont
and Sudjukskaya lagoon in
northeast of the Black Sea
N/A
Green Don
Improvement of the
12 months
5,000
Strategic Action Proposal
in order to promote the
conservation of
biodiversity and fish stocks
in the Black Sea
Low
Sochi State
Develop ways and water
24 months
20,000*
U niversity
purification facilities in
small rivers and temporary
waterways of the Caucasus
Black Sea coast
ROMANIA
Low-
EcoCouncelling
Raising Public Awareness
24 months
24, 670*
Medium
Center Galati
and Involvement in
Reducing the Dan ube's
nutrients Load, so as to
protect the Black Sea
N/A
Daciafilm the
Save the Life in the Black
12 months
23,942*
7th Art
Sea
Foundation
GEORGIA
Low
GAEC -- Guria
Infobus for Kolkheti
Youth
Wetlands 2001
Ecocenter
Low
Foundation
Eutrophication and
Caucasus
Harmful Algal Bloom
Environment
Events in Georgian Black
Sea Coast
Low
The Greens
"Kolkheti Wetlands --
Movement of
Surviving Together"
Georgia/Friends
of the Earth
N/A
Zoology
Production and use of
Institute of the
ecologically clean organic
Academy of
fertilizer on the basis of
173
Academy of
fertilizer on the basis of
Sciences of
local worm
Georgi a
BULGARIA
Low
ECO -CLUB
Restoration and conservation
2000
of the Black Sea coastal river
firths in Bulgaria
Low
ECO -CLUB
The creation of constructed
2000
wetlands (feasibility study)
174
Annex II.
CALL FOR PROPOSALS
GEF/BSEP SMALL GRANTS P R O G R A M M E
The Black Sea Environmental Programme (BSEP) is announcing Call for Proposals
to be submitted for the projected new phase of the Global Environment Facility
(GEF) support to the Black Sea countries of Bulgaria, Georgia, Romania, Russia,
Turkey and Ukraine.
Background Information
From 1993 until 1997 the GEF together with other donors, has funded the Black Sea
Environmental Programme. This Programme has enabled many specialists from
Black Sea countries to integrate their efforts in understanding the state of the Black
Sea and propose measures to protect and restore its environment. Specifically, it has
resulted in a comprehensive assessment of the environmental problems in the Black
Sea and their causes. Based on this technical document, the Black Sea Strategic
Action Plan (BSAP) was approved in 1996. In BSAP, the governments of Black Sea
countries committed themselves to a long-term programme of actions to protect the
Black Sea.
The environmental assessment of the Black Sea revealed that the major cause of
chronic degradation in the sea is a phenomenon known as eutrophication (excessive
production of organic material in the sea). Eutrophication in the Black Sea has been
caused by an increase in the discharge of nitrogen and phosphorus compounds to the
Sea or to its tributary rivers. These compounds, often referred to as nutrients, have
resulted in massive growth of the tiny floating plants (phytoplankton) that form the
basis of the Sea's food chain. This has led to major changes in the Black Sea
ecosystem and the loss of important plant and animal communities. Many of these
changes may be reversed, if the discharge of nutrients is returned to levels similar to
those encountered some 40 years ago.
The proposed new phase of the GEF Black Sea Environmental Programme focuses
on the control of eutrophication. Public participation will be an important
component of this project. The present call for proposals aims to facilit ate the
design of the public participation sub-component. The amount of funding for this
sub-component largely depends on the level of interest and commitment expressed
by local communities in the Black Sea region. Simply expressed, if there are no
proposals from the region, there will be no funding.
What kind of projects will be supported?
Projects should contribute to
minimising eutrophication
in the Black Sea. The
175
following types of projects
are particularly encouraged:
� Restoration and conservation of wetlands
� Promotion of organic (chemical-free) agriculture and farming
� Introduction of low -technology waste water treatment techniques in small
coastal communities
� Promotion of phosphate-free detergents
� Production of visual educational materials for schools, local authorities and
general public on:
a) the ecological role of wetlands and the need for their preservation
b) the techniques and importance of water conservation
c) problems and solutions (low-technology) of wastewater treatment
Eligibility
� NGOs which are formally registered as a distinct legal entity and are active in
the Black Sea work in Bulgaria, Georgia, Romania, Russia, Turkey, and
Ukraine7
� Community-based educational organisations (schools, clubs, youth groups, etc.)
What grants will be available?
The amount of funding for each Black Sea country will depend directly on the
number and quality of submitted proposals. Just as a general guidance, it is hoped to
raise at least US $50,000 per country. Individual projects can range from US $5,000
to 25,000.
Project duration
Longer -term projects (2-3 years) are encouraged. Shorter projects will also be
considered.
Language of the project proposal
The project proposals should be submitted in English language only
Selection Process
First Stage: All submitted project proposals will be evaluated by a committee of
Black Sea and international experts to make sure that they: (1) correspond to the set
criteria, (2) can be realistically implemented, and (3) that the impact can be
sustained over a longer period of time. The results of this initial evaluation will be
known by the end of June 2000.
Second Stage: Pre-selected proposals will be incorporated in the overall Nutrient
Reduction Programme for the Black Sea and submitted to the GEF Council for final
approval. The meeting of the GEF Council will take place in November 2000. The
7 Proposals from coastal NGOs will be given priority, although all relevant NGOs are encouraged to
apply.
176
final decision on the Small Grants will be communicated to the successful applicants
by the end of November 2000.
Due to this lengthy timeframe, all projects should be designed to begin no earlier
than January 2001.
Please, strictly follow the application guidelines and send the original of your
proposal to:
GEF Small Grants Programme
BSEP PIU
Dolmabahce Sarayi, II Harekat Kosku
80680 Besiktas, Istanbul
Turkey
E-mail a copy of your proposal to: rmihnea@dominet.in.com.tr
If you have any questions regarding this Call for Proposals, you can contact
Olga Maiboroda at: olgam@btinternet.com
Deadline for submitting project proposals is 20 May 2000
APPLICATION GUIDELINES
The length of a project proposal should not exceed 4 pages , including:
1. Cover page (see format attached)
2. Project description. Please describe the local situation, specifically
focusing on the following:
What do you want to achieve?
Why is it needed?
How will it make a difference?
3. List expected results of the project
4. Timetable of project implementation. Please follow the format below:
Description of the
Full name(s) and
Period of
activity
qualifications of responsible
implementation
person (people)
1
2
5. Budget
Please, develop your budget in USD, providing examples for each budget item
on how it is calculated. Below we suggest a possible format for presenting
your budget.
Project expenses
Amount
Contributio
Contributio
requested
ns of other
n of your
from the
donors/
organisatio
177
GEF
Organisatio
n
ns
People fees (number of people, their
titles within the project, duration of
their involvement, total amount)
Proje ct materials (prices for each
item, total amount)
Communication (phone, fax, mail, e-
mail, total amount)
Rent of any required equipment,
space (purpose for renting, dates,
cost of each item, total amount)
Publishing expenses (if appropriate).
Other categories of expenses...
TOTAL BUDGET
Attached to the project proposal please include:
1. Copy of registration of the organisation
2. CV of the Project Co-ordinator
GEF Black Sea Small Grants Programme
Project Proposal
Cover Page
Country
Proposing organisation:
Name
Address
Phone/fax
E-mail)
Project title
Project duration
Short description of project
objectives and activities
(maximum 10 lines)
178
Project budget:
Total amount:
Amount requested from the
GEF:
Bank account in USD (if the
organisation has one)
179
180
Annex III
GEF/BSEP Small Grants Programme
Evaluation Sheet
Country:
Name of NGO:
Title of Project:
Score
(1 -- lowest
Category
Comments
10 --
highest)
Contribution to
minimizing
eutrophication
in the Black
Sea
Public
involvement
Cooperation with
other
stakeholders
Feasibility of
achieving
planned results
Clear indicators
of measuring
progress
180
181
Sustainability of
this project (its
outcome) over a
longer term
Replicability
Cost/benefit
analysis
Experience/qualif
ications of
Project Co-
ordinator
Total Score
Concluding recommendation:
Evaluator:
Date:
181
182
Annex 12
ENHANCEMENT OF LEGISLATIVE PROVISIONS FOR
REDUCTION OF NUTRIENTS INPUT TO THE BLACK SEA.
A report prepared by I. Zrazhevsky on the request of UNEP/ROE.
Sankt-Petersburg-Geneva 2000.
182
183
Content.
paragraphs
I. Introduction 1 - 9
II. An objective of the revision of the Protocol and main
elements suggested for amendments. 10
RECENT INTERNATIONAL DEVELOPMENTS IN
COMBATING POLLUTION FROM LBS.
Global Programme of Action for the Protection of the
Marine Environment from Land-based Activities. 11 - 17
UNEP Regional Seas Programme and amended Protocol for the
Protection of the Mediterranean Sea against Pollution from
Land-Based Sources and Activities. 18 - 23
European Union Water Framework Directive. 24
- 31
MAIN ELEMENTS TO BE INCLUDED IN THE
AMENDED PROTOCOL.
Provisions for the development and implementation of
a Black Sea basin wide approach. 32 - 41
Provisions for preparation of the regional action plan and
country level investment projects for nutrient reduction. 42 - 47
III. Conclusions and recommendations. 48 - 50
AN OUTLINE OF THE UNEP's ACTIONS TO BE
UNDERTAKEN FOR THE REVISION OF THE PROTOCOL 51 -
54
Annex 1 : Environmental Cooperation in the Black Sea region
Annex 2 : Participation of the European countries in the
Conventions for protection of water bodies.
Annex 3 : Protocol for the Protection of the Mediterranean Sea
Against Pollution from Land-Based Sources and Activities.
Annex4 : Protocol on Protection of the Black Sea Marine Environment
Against Pollution from Land Based Sources.
Annex5 Draft amended Protocol on Protection of the of the Black Sea Marine
Environment Against Pollution from Land Based Sources.
183
184
Annex 1.
Environmental Cooperation in the Black Sea region.
(Position paper prepared by I. Zrajevskij, ROE, Senior Natural Resources
Officer, September 1996)
Background:
The possibility to develop a Regional Seas Action Plan for the Black Sea was
first explored by OCA/PAC in 1987.
In 1989 the Governing Council of UNEP at its Fifteenth Session (Decision
15/1 "Strengthening the role and effectiveness of the United Nations
Environmental Programme", part VI.3) approved "preparation of new action
plans for seas not yet covered by the regional seas programme (North-West
Pacific, Black Sea)" as one of the activities listed within "Supplementary
Programme of Environment Fund Activities for the Biennium 1990-1991"
attached as an Annex to the quoted decision. The practical steps of the
preparation of the regional seas programme for the Black Sea started in 1991
when the fund for the UNEP Supplementary Programme was approved.
UNEP reported on its activities in the region to the Diplomatic Conference on
the Protection of the Black Sea against Pollution (Bucharest, 21-22 April
1992). At the Conference the Governments of Bulgaria, Georgia, Romania,
Russian Federation, Ukraine and Turkey signed the following legal
instruments:
-Convention on the Protection of the Black Sea against Pollution;
-Protocol on Protection of the Black Sea against Pollution from Land-based
Sources;
-Protocol on Cooperation in Combating Pollution of the Black Sea Marine
Environment by Oil and other Harmful Substances in Emergency Situations;
-Protocol on the Protection of the Black Sea Marine Environment against
Pollution by Dumping;
They also decided "to invite UNEP -OCA/PAC Regional Seas Programme to
cooperage with the Contracting Parties and/or the Commission for the
elaboration of a Black Sea Action Plan..." (Resolution 3 - "Cooperation with
intergovernmental organizations").
The Convention is ratified by all participating countries. However, the
Secretariat of the Convention is not established yet due to the la ck of a fund.
184
185
Annex1
As a first concrete step in the context of the requested long- term action plan for the
Black Sea a Ministerial Declaration on the Protection of the Black Sea was initiated.
With UNEP assistance the Declaration was prepared and adopted at the Ministerial
meeting in Odessa, Ukraine on 6-7 April 1993. The Declaration constitutes an
interim framework Black Sea Action Plan and establishes explicit environmental
goals and a time-frame in order to concentrate national, regional and international
resources on the most effective measures. It provides a common policy framework
able to respond to the changing problems and institutes a mechanism for regular
review and the evaluation of achievements and required amendments.
The Final Act of the Ministerial meeting calls upon "the Executive Director of
UNEP to provide continued assistance to the Black Sea countries and the
Commission on the Protection of the Black Sea Against Pollution to review the
implementation of this Declaration, to develop recommendations on actions required
to enhance implementation or to further develop the Declaration and in preparation
of a consolidated triennial report on the status of the implementation of the
provisions of the Declaration.�
In order to make an early start to environmental action and to develop a longer-term
Action Plan, the Black Sea countries requested support from the Global Environment
Facility, GEF, a fund established in 1991 under the management of the World Bank,
UNDP and UNEP. In June 1993, a three-year Black Sea Environmental Programme
(BSEP) was established with US$ 9.3 million funding from GEF and collateral
funding from the European Union (Phare and Tacis), The Netherlands, France,
Austria, Canada and Japan.
UNEP was not considered an appropriate agency for running a project of this
magnitude and, therefore, UNDP was selected as a lead agency for BSEP. However,
there were good relations between UNEP and BSEP mostly due to the fact that
coordinator, Mr. L. Mee formally UNDP staff, had close links with OCA/PAC and
UNEP Regional Seas Programme. Black Sea was considered to be one of the regions
covered by the UNEP Regional Seas Programme. Odessa Declaration provides the
framework Black Sea Action Plan. UNEP is a member of the Steering Committee
that consists of representatives of the Governments, NGOs and GEF partners/and
associate donors. The Steering Committee at its annual meetings determines the
overall strategy for the GEF Project "Environmental Management and Protection of
the Black Sea". UNEP is also a member of National Coordinators Contact Group.
The Group consists of the Government representatives (the National Coordinators)
and GEF partners only. It is established to oversee the project management, review
the work plan and assure the harmonious development of project activities within the
region.
BSEP resulted in the establishing and operating a network linking more than 40
institutions around the Black Sea and successful completion of the electronic mail
network. The BSEP has contributed more than US$ 1.5 million to re-equipping its
pollution monitoring network. The BSEP's environmental investment programme,
led by the World Bank, has supported the development of an Urgent Investment
185
186
Annex1
Portfolio which has already led to an US$ 18 millio n emergency concessionaire loan
to your country. Finally BSEP has assisted with the preparation of a strategic Black
Sea Action Plan to be presented to a Ministerial Conference for adoption in October
1996.
UNEP's contribution to the strategic Black Sea Action Plan relates to the problem of
ctenophore Mnemiopsis Leidyi.The natural features of the Black Sea, such as its
huge volume of anoxic waters, its relative isolation from the open ocean, and its vast
drainage basin, make the ecosystem extremely vulnerable to both anthropogenic
impact and intervention of opportunistic, alien species. The ecosystem of the Black
Sea was drastically affected by a voracious animal Mnemiopsis leidyi, a ctenophore
that was most likely introduced with ballast water. The first records of Mnemiopsis
in the Black Sea date back to 1982. At that time it occupied only bays and coastal
waters. Yet, during the summer of 1988 Mnemiopsis began invading the open area of
the sea, and by that autumn, its biomass reached 1.5 kg/sq.m. In 1989 and 1990 the
biomass of Mnemiopsis continued to grow, reaching 10- 12 kg/sq.m. in several
coastal areas. In 1991 the biomass began to decrease and declined gradually to its
current level that is 4- 6 times less than that of 1989.
The Mnemiopsis invasio n has had a severe impact on the Black Sea fisheries and
fishing industry. As a result of the Mnemiopsis invasion, the pelagic fish stock,
which is the remaining commercially important resource, drastically decreased after
1988, and the Black Sea fishing industry collapsed. Total catches, estimated at
900,000 tons in 1986, fell to about 100,00 tons for all countries in 1992. Worst hit
was Turkey, which in the 1970s and early 1980s relied on the Black Sea for 80
percent of all its fish. The total Turkish catches in the Black Sea and the sea of
Marmara was nearly 500,000 tons in 1988, much of it anchovies. The following year
the catch was almost halved at 264,000 tons. Judging by the throughput at Turkey's
largest anchovy plant in Trabzon, the total fish catch may have fallen as low as 70-
80,000 tons by 1991 (Data from "Saving the Black Sea", Official newsletter of the
Global Environment Facility Black Sea Environmental Programme, Issue 1, Sept.
1994).
UNEP assisted the Black Sea countries with the preparation of a strategy for the
control of Mnemiopsis through GESAMP. In cooperation with IMO, FAO and
UNESCO we convened two meetings of the GESAMP Working Group on
Opportunistic Settlers and Problem of the Ctenophore Mnemiopsis Leidyi in the
Black Sea. The report of the working Group: �The Invasion of the Ctenophore
Mnemiopsis Leidyi in the Black Sea� was approved by GESAMP for publication as
GESAMP Reports and Studies No 58". The results will be reflected in the strategic
Black Sea Action Plan.
The Odessa Declaration was adopted in April 1993. Therefore, a triennial report on
its implementation requested from the UNEP Executive Director is due in the first
half of 1996.In order to meet the obligation UNEP requested all participating
countries to prepare national triennial reports on implementation of the Odessa
Declaration and recommendations on actions required to enhance implementation or
186
187
Annex1
to further develop the Declaration. On their basis UNEP will prepare a regional
report on the implementation of the Declaration and recommendations on its further
development or establishment of a new high level mechanism for regular review of
achievements in the efficiency of coordinated actions for rehabilitation and
protection of the Black Sea ecosystem. The regional report will be presented by
UNEP to the Ministerial Conference in October 1996.
Present situation in brief:
UNEP has relations with the following three interrelated but independent frames for
environmental cooperation in the Black Sea region:
- GEF Black Sea Environmental Programme (BSEP) with UNDP Programme
Coordinating Unit (PCU) in Istanbul. Most active programmes With US$ 9.3
million funding from GEF and collateral funding from the European Union (Phare
and Tacis), The Netherlands, France, Austria, Canada and Japan. UNEP has good
relations with PCU. BSEP is also recognized as one of the regional seas
programmes. UNEP took a lead role in assisting countries with the preparation of a
strategy for the control of ctenophore Mnemiopsis Leidyi through GESAMP. At
present GEF project is formally closed. UNDP supports PCU pending approval of a
GEF bridging project of one year duration and 1.5 million US$ value. One side of a
bridge is the present situation; nobody has clear picture what should be at the other
side of the bridge. In October 1996 a Ministerial Conference will be convened in
order to approve the Strategic Black Sea Action Plan and decide on the future of
BSEP.
- Convention on the Protection of the Black Sea against Pollution with three
protocols. The Convention is ratified by all participating countries. However, the
Secretariat of the Convention is not established yet due to the lack of national funds.
There is a possibility that countries will invite UNEP to provide Secretariat for the
Convention if UNEP is able to support it.
- Ministerial Declaration on the Protection of the Black Sea. The Declaration
constitutes an interim framework Black Sea Action Plan and establishes explicit
environmental goals and a time-frame in order to concentrate national, regional and
international resources on the most effective measures. The Executive Director of
UNEP is requested to provide continued assistance to the Black Sea countries and
the Commission on the Protection of the Black Sea Against Pollution to review the
implementation of the Declaration, to develop recommendations on actions required
to enhance implementation or to further develop the Declaration and in preparation
of a consolidated triennial report on the status of the implementation of the
provisions of the Declaration. UNEP is preparing a regional triennial report on the
implementation of the Declaration and recommendations on its further development
or establishment of a new high level mechanism for regular review of achievements
in the efficiency of coordinated actions for rehabilitation and protection of the Black
187
188
Annex1
Sea ecosystem. The report will be presented by UNEP to the Ministerial Conference
in October 1996. Participation of a UNEP high level official is necessary.
Conclusions and recommendations:
1. There is a political will in the region to continue cooperation. However, most of
the Black Sea countries could not provide national resources to support cooperation
due to economical difficulties. Continuation of the GEF support after a bridging
project of one year duration and 1.5 million US$ value is not certain. UNEP should
promote continuation of the GEF support in order to preserve and wisely use
the capacity created in the region for the cooperation in the protection and
restoration of the Black Sea ecosystem. More emphasis of BSEP on the
implementation of the Global Programme of Action for the Protection of the Marine
Environment from Land-Based Activities might help to secure support.
188
189
Annex1
2. The financial situation in UNEP does not indicate any possibility to
provide support for the Secretariat of the Black Sea Convention at the
required level in the near future. Therefore, we are not suggesting
encouraging countries to amend the Convention in order to have a possibility
to request UNEP to provide for the Secretariat of the Convention. We suggest
supporting establishment of a Programme Implementation Unit (for
coordination of Implementation of BSAP) integrated into the Secretariat
of the Convention. We should assist countries and UNDP in securing funds
for the Secretariat of the Convention and implementation of BSAP. We can
suggest, for example, to use unfrozen Russian funds to support Secretariat of
the Convention.
3. As it is mentioned above all participating countries are preparing national
triennial reports on implementation of the Odessa Declaration and
recommendations on actions required to enhance implementation or to further
develop the Declaration. They were also asked to indicate their preference: to
continue with the process established by the Odessa Declaration (national
and regional reports prepared by consultants under the auspice of UNEP and
Ministerial Conference) or to institute a new high level mechanism for regular
review of achievements in the efficiency of coordinated actions for
rehabilitation and protection of the Black Sea ecosystem. It is difficult to
predict what options countries will finally select, as the positions are
different. The Odessa Declaration has two main purposes: to serve as an
interim framework Black Sea Action Plan and to institute a mechanism for
regular review of achievements in the efficiency of coordinated actions . The
first purpose will be redundant after approval of BSAP. There are three
following options as regards the second purpose:
- to incorporate a review mechanism into BSAP;
- to use Secretariat of the Convention for reviewing the efficiency of
coordinated actions;
- to continue with the process established by the Odessa Declaration.
The third option is our preference at the moment. However, we should come
back to the problem after having received triennial reports.
189
190
Annex1
Annex 2
Participation of the European countries in the Conventions for protection
of water bodies.
Country member
Bordering Seas
Catchment basins Participation
of ECE and the
in the main
region
regional and
global
conventions
Albania (CE)
Mediterranean Sea
Mediterranean
ECE Water
Sea, Black Sea
RamC
BarC
Andorra (WE)
Mediterranean Sea
RamC
Armenia (EE)
Caspian Sea
RamC
Austria (WE)**
Black Sea
UNCLOS
MARPOL
ECE Water
RamC
DanC
Azerbaijan (EE)
Caspian Sea
Caspian Sea
CAS
Belarus (EE)
Baltic Sea, Black
MARPOL
Sea
Belgium (WE)**
North Sea
North Sea
MARPOL
RamC
OSPAR
Bosnia and
Mediterranean Sea
Mediterranean
BarC
Herzegovnia (CE)
Sea, Black Sea
Bulgaria (CE)*
Black Sea
Mediterranean
UNCLOS
Sea, Black Sea
MARPOL
RamC
BucC
DanC
Canada
Croatia (CE)
Mediterranean Sea
Mediterranean
UNCLOS
Sea, Black Sea
MARPOL
ECE Water
RamC,DanC
BarC
Cyprus (CE)*
Mediterranean Sea Mediterranean Sea
UNCLOS
190
191
Annex1
MARPOL
BarC
Czech. Republic
North Sea, Black
UNCLOS
(CE)*
Sea, Baltic Sea
MARPOL
RamC, DanC
Denmark (WE)** Baltic Sea, North
Baltic Sea, North
MARPOL
Sea
Sea
RamC
OSPAR
HelC
Bordering Seas
Catchment basins Participation
Country member
in the main
of ECE
regional and
global
conventions
Estonia
Baltic Sea
Baltic Sea
ECE Water
RamC
HelC
Finland (WE)**
Baltic Sea
Baltic Sea
UNCLOS
MARPOL
ECE Water
RamC
HelC
France (WE)**
North Atlantic
Mediterranean
UNCLOS
Ocean,
Sea, North Sea
MARPOL
Mediterranean
RamC
Sea, North Sea
BarC
BerC
OSPAR
Georgia (EE )
Black Sea
Black Sea,
UNCLOS
Caspian Sea
MARPOL
RamC
BucC
Germany (WE)**
Baltic Sea, North
Baltic Sea, North
UNCLOS
Sea
Sea, Black Sea
MARPOL
ECE Water
RamC
HelC
DanC
OSPAR
BerC
Greece (WE)**
Mediterranean Sea Mediterranean Sea
UNCLOS
MARPOL
ECE Water
191
192
Annex1
RamC
BarC
Hungary (CE)*
Black Sea
MARPOL
ECE Water
RamC, DanC
Iceland (WE)
North Atlantic
North Atlantic
UNCLOS
Ocean
Ocean
MARPOL
RamC
OSPAR
Ireland (WE)**
North Atlantic
North Atlantic
UNCLOS
Ocean
Ocean
MARPOL
RamC
OSPAR
Israel (WE)
Mediterranean Sea Mediterranean Sea
MARPOL
RamC
BarC
Participation
Country member
Bordering Seas
Catchment basins
in the main
of ECE
regional and
global
conventions
Italy (WE)**
Mediterranean Sea
Mediterranean
UNCLOS
Sea, Black Sea
MARPOL
ECE Water
RamC
BarC
Kazakstan (CA)
Caspian Sea, Aral
Caspian Sea, Aral
MARPOL
Sea
Sea
CAS
Kyrgyzstan (CA)
Aral Sea
Latvia (CE)*
Baltic Sea
Baltic Sea
MARPOL
ECE Water
RamC
HelC
Liechtenstein
North Sea
RamC
(WE)
Lithuania (CE)*
Baltic Sea
Baltic Sea
MARPOL
RamC
HelC
192
193
Annex1
Luxembourg
North Sea
MARPOL
(WE)**
ECE Water
BerC
OSPAR
Malta (WE)*
Mediterranean Sea Mediterranean Sea
UNCLOS
MARPOL
RamC
BarC
Moldova (EE)
Black Sea
ECE Water
DanC
Monaco (WE)
Mediterranean Sea Mediterranean Sea
UNCLOS
MARPOL
BarC
Netherlands
North Sea
North Sea
UNCLOS
(WE)**
MARPOL
ECE Water
RamC
BerC
OSPAR
Norway (WE)
North Sea
North Sea, Baltic
UNCLOS
Sea
MARPOL
ECE Water
RamC
OSPAR
Poland (CE)*
Baltic Sea
Baltic Sea, Black
MARPOL
Sea
ECE Water
RamC
HelC
Country member
Bordering Seas
Catchment basins
of ECE
Participation
in the main
regional and
global
conventions
Portugal (WE)**
North Atlantic
North Atlantic
UNCLOS
Ocean
Ocean
MARPOL
RamC
ECE Water
OSPAR
Romania (CE)*
UNCLOS
Black Sea
Black Sea
MARPOL
ECE Water
RamC
193
194
Annex1
DanC
BucC
Former Yugoslav Mediterranean Sea
Mediterranean
RamC
Republic of
Sea, Black Sea
Macedonia (CE)
Russian
Sea of Azov,
Sea of Azov,
UNCLOS
Federation (EU)
Black Sea, Baltic
Black Sea, Baltic
MARPOL
Sea, Caspian Sea
Sea, Caspian Sea
ECE Water
RamC
HelC
BucC
CAS
San Marino (WE)
Mediterranean Sea
Slovakia (CE)*
Black Sea
UNCLOS
MARPOL
ECE Water
DanC
Slovenia (CE)*
Mediterranean Sea
Mediterranean
UNCLOS
Sea, Black Sea
RamC
MARPOL
BarC, DanC
Spain (WE)**
Mediterranean
Mediterranean
UNCLOS
Sea, North
Sea, North
MARPOL
Atlantic Ocean
Atlantic Ocean
RamC, BarC
OSPAR
Sweden (WE)**
Baltic Sea, North
Baltic Sea, North
UNCLOS
Sea
Sea
MARPOL
ECE Water
RamC, H elC
OSPAR
Switzerland
Mediterranean
MARPOL
Sea, North Sea,
ECE Water,
Black Sea
RamC, BerC
OSPAR
Country member
Bordering Seas
Catchment basins Participation
of ECE
in the main
regional and
global
conventions
Tajikistan (CA)
Aral Sea
T urkey (CE)
Black Sea,
Black Sea,
MARPOL
Mediterranean Sea
Mediterranean
RamC
194
195
Annex1
Mediterranean Sea
Sea, Caspian Sea
BucC
BarC
Turkmenistan
Caspian Sea
Caspian Sea, Aral
CAS
(CA)
Sea
Ukraine (EE)
Sea of Azov,
Sea of Azov,
MARPOL
Black Sea
Black Sea, Baltic
ECE Water
Sea
RamC, BucC
DanC
United Kingdom
North Sea, North
North Sea, North
UNCLOS
(WE)**
Atlantic Ocean
Atlantic Ocean
MARPOL
RamC
OSPAR
United States
Uzbekistan (CA)
Aral Sea
Aral Sea
Yugoslavia (CE)
Mediterranean Sea
Mediterranean
UNCLOS
Sea, Black Sea
MARPOL
RamC
**Member of the European Union (EU)
*countries applied to be members of EU
Abbreviations:
CA - Central Asia.
CE � Central Europe.
EE � Eastern Europe.
WE � Western Europe.
UNCLOS � United Nations Convention on the Law of the Sea.
MARPOL 73/78 - International Convention for the Prevention of Pollution
from Ships.
RamC � Ramsar Convention on Wetlands of International Importance
especially as Waterfowl Habitat.
ECE Water - ECE Convention on the Protection and Use of Transboundary
Watercourses and International lakes.
BarC - Barcelona Convention for the Protection of the Mediterranean Sea
against pollution.
BerC - Berne Convention on the Protection of the Rhine.
BucC � Bucharest Convention on the Protection of the Black Sea against
Pollution.
CAS � Framework Convention for the Protection of the Marine Environment
of the Caspian Sea. The name of the convention is a preliminary one as it is
still under the negotiations.
195
196
Annex1
DanC - Convention on Cooperation for the Protection and Sustainable Use of
the River Danube.
HelC �Helsinki Convention for the Protection of the Marine Environment of
the Baltic Sea Area.
OSPAR � Convention on the Protection of the Marine Environment of the
North-East Atlantic.
196
197
Annex1
Annex 3.
Protocol for the Protection of the Mediterranean Sea against
Pollution from Land-Based Sources and Activities
(As amended in Syracusa, Italy, 7 March 19967 March 1996)
The Contracting Parties to the present Protocol,
Being Parties to the Convention for the Protection of the
Mediterranean Sea against Pollution, adopted at Barcelona on 16
February 1976 and amended on 10 June 1995,
Desirous of implementing article 4, paragraph 5, and articles 8 and
21 of the said Convention,
Noting the increasing environmental pressures resulting from human
activities in the Mediterranean Sea Area, particularly in the fields
of industrialization and urbanization, as well as the seasonal
increase in the coastal population due to tourism,
Recognizing the danger posed to the marine environment, living
resources and human health by pollution from land-based sources and
activities and the serious problems resulting therefrom in many
coastal waters and river estuaries of the Mediterranean Sea,
primarily due to the release of untreated, insufficiently treated or
inadequately disposed of domestic or industrial discharges
containing substances that are toxic, persistent and liable to
bioaccumulate,
Applying the precautionary principle and the polluter pays
principle, undertaking environmental impact assessment and utilizing
the best available techniques and the best environmental practice,
including clean production technologies, as provided for in article
4 of the Convention,
Recognizing the difference in levels of development between the
coastal States, and taking account of the economic and social
imperatives of the developing countries,
Determined to take, in close cooperation, the necessary measures to
protect the Mediterranean Sea against pollution from land-based
sources and activities,
Taking into consideration the Global Programme of Action for the
Protection of the Marine Environment from Land-Based Activities,
adopted in Washington, D.C., on 3 November 1995,
Have agreed as follows:
197
198
Annex1
Article 1
GENERAL PROVISION
1. The Contracting Parties to this Protocol (hereinafter referred to as "the Parties")
shall take all appropriate measures to prevent, abate, combat and eliminate to the
fullest possible extent pollution of the Mediterranean Sea Area caused by
discharges from rivers, coastal establishments or outfalls, or emanating from any
other land-based sources and activities within their territories, giving priority to
the phasing out of inputs of substances that are toxic, persistent and liable to
bioaccumulate.
Article 2
DEFINITIONS
1. For the purposes of this Protocol:
(a) "The Convention" means the Convention for the Protection of the
Mediterranean Sea against Pollution, adopted at Barcelona on 16 February
1976 and amended on 10 June 1995;
(b) "Organization" means the body referred to in article 17 of the Convention;
(c) "Freshwater limit" means the place in watercourses where, at low tides
and in a period of low freshwater flow, there is an appreciable increase in
salinity due to the presence of sea-water;
(d) The "Hydrologic Basin" means the entire watershed area within the territories of
the Contracting Parties, draining into the Mediterranean Sea Area as defined in
article 1 of the Convention.
Article 3
PROTOCOL AREA
1. The area to which this Protocol applies (hereinafter referred to as the "Protocol
Area") shall be:
(a) The Mediterranean Sea Area as defined in article 1 of the Convention;
(b) The hydrologic basin of the Mediterranean Sea Area;
198
199
Annex1
(c) Waters on the landward side of the baselines from which the breadth of the
territorial sea is measured and extending, in the case of watercourses, up
to the freshwater limit;
(d) Brackish waters, coastal salt waters including marshes and coastal
lagoons, and ground waters communicating with the Mediterranean Sea.
Article 4
PROTOCOL APPLICATION
1. This Protocol shall apply:
(a) To discharges originating from land-based point and diffuse sources and activities
within the territories of the Contracting Parties that may affect directly or
indirectly the Mediterranean Sea Area. These discharges shall include those which
reach the Mediterranean Area, as defined in article 3(a), (c) and (d) of this
Protocol, through coastal disposals, rivers, outfalls, canals, or other watercourses,
including ground water flow, or through run-off and disposal under the seabed
with access from land;
(b) To inputs of polluting substances transported by the atmosphere to the
Mediterranean Sea Area from land-based sources or activities within the territories
of the Contracting Parties under the conditions defined in annex III to this
Protocol.
2. This Protocol shall also apply to polluting discharges from fixed man-made
offshore structures which are under the jurisdiction of a Party and which serve
purposes other than exploration and exploitation of mineral resources of the
continental shelf and the sea-bed and its subsoil.
3. The Parties shall invite States that are not parties to the Protocol and have in their
territories parts of the hydrologic basin of the Mediterranean Area to cooperate in
the implementation of the Protocol.
Article 5
GENERAL OBLIGATIONS
199
200
Annex1
1. The Parties undertake to eliminate pollution deriving from land-based sources and
activities, in particular to phase out inputs of the substanc es that are toxic,
persistent and liable to bioaccumulate listed in annex I.
2. To this end, they shall elaborate and implement, individually or jointly, as
appropriate, national and regional action plans and programmes, containing
measures and timetables for their implementation.
3. The priorities and timetables for implementing the action plans, programmes and
measures shall be adopted by the Parties taking into account the elements set out
in annex I and shall be periodically reviewed.
4. When adopting action plans, programmes and measures, the Parties shall take into
account, either individually or jointly, the best available techniques and the best
environmental practice including, where appropriate, clean production
technologies, taking into account the criteria set forth in annex IV.
5. The Parties shall take preventive measures to reduce to the minimum the risk of
pollution caused by accidents.
Article 6
AUTHORIZATION OR REGULATION SYSTEM
1. Point source discharges into the Protocol Area, and releases into water or
air that reach and may affect the Mediterranean Area, as defined in article
3(a), (c) and (d) of this Protocol, shall be strictly subject to authorization
or regulation by the competent authorities of the Parties, taking due
account of the provisions of this Protocol and annex II thereto, as well as
the relevant decisions or recommendations of the meetings of the
Contracting Parties.
2. To this end, the Parties shall provide for systems of inspection by their competent
authorities to assess compliance with authorizations and regulations.
3. The Parties may be assisted by the Organization, upon request, in establishing
new, or strengthening existing, competent structures for inspection of compliance
with authorizations and regulations. Such assistance sha ll include special training
200
201
Annex1
of personnel. 4. The Parties establish appropriate sanctions in case of non-
compliance with the authorizations and regulations and ensure their application.
Article 7
COMMON GUIDELINES, STANDARDS AND CRITERIA
1. The Parties shall progressively formulate and adopt, in cooperation with the
competent international organizations, common guidelines and, as appropriate,
standards or criteria dealing in particular with:
(a) The length, depth and position of pipelines for coastal outfalls, taking into
account, in particular, the methods used for pretreatment of effluents;
(b) Special requirements for effluents necessitating separate treatment;
(c) The quality of sea-water used for specific purposes that is necessary for
the protection of human health, living resources and ecosystems;
(d) The control and progressive replacement of products, installations and
industrial and other processes causing significant pollution of the marine
environment;
(e) Specific requirements concerning the quantities of the substances
discharged (listed in annex I), their concentration in effluents and methods
of discharging them.
2. Without prejudice to the provisions of article 5 of this Protocol, such common
guidelines, standards or criteria shall take into account local ecological,
geographical and physical characteristics, the economic capacity of the Parties and
their need for development, the level of existing pollution and the real absorptive
capacity of the marine environment.
3. The action plans, programmes and measures referred to in articles 5 and
15 of this Protocol shall be adopted by taking into account, for their
progressive implementation, the capacity to adapt and reconvert existing
installations, the economic capacity of the Parties and their need for
development.
Article 8
MONITORING
1. Within the framework of the provisions of, and the monitoring programmes
provided for in article 12 of the Convention, and if necessary in cooperation with
the competent international organizations, the Parties shall carry out at the ea rliest
possible date monitoring activities and make access to the public of the findings in
order:
(a) Systematically to assess, as far as possible, the levels of pollution along their
coasts, in particular with regard to the sectors of activity and categories of
substances listed in annex I, and periodically to provide information in this
respect;
201
202
Annex1
(b) To evaluate the effectiveness of action plans, programmes and measures
implemented under this Protocol to eliminate to the fullest possible extent
pollution of the marine environment.
Article 9
SCIENTIFIC AND TECHNICAL COOPERATION
1. In conformity with article 13 of the Convention, the Parties shall cooperate in
scientific and technological fields related to pollution from land-based sources and
activities, particularly research on inputs, pathways and effects of pollutants and
on the development of new methods for their treatment, reduction or elimination,
as well as the development of clean production processes to this effect. To this
end, the Parties shall, in particular, endeavor to:
(a) Exchange scientific and technical information;
(b) Coordinate their research programmes;
(c) Promote access to, and transfer of, environmentally sound technology
including clean production technology.
Article 10
TECHNICAL ASSISTANCE
1. The Parties shall, directly or with the assistance of competent regional or
other international organizations, bilaterally or multilaterally, cooperate
with a view to formulating and, as far as possible, implementing
programmes of assistance to developing countries, particularly in the
fields of science, education and technology, with a view to preventing,
reducing or, as appropriate, phasing out inputs of pollutants from land-
based sources and activities and their harmful effects in the marine
environment.
2. Technical assistance would include, in particular, the training of scientific
and technical personnel, as well as the acquisition, utilization and
production by those countries of appropriate equipment and, as
appropriate, clean production technologies, on advantageous terms to be
agreed upon among the Parties concerned.
Article 11
TRANSBOUNDARY POLLUTION
202
203
Annex1
1. If discharges from a watercourse which flows through the territories of two or
more Parties or forms a boundary between them are likely to cause pollution of
the marine environment of the Protocol Area, the Parties in question, respecting
the provisions of this Protocol in so far as each of them is concerned, are called
upon to cooperate with a view to ensuring its full application.
2. A Party shall not be responsible for any pollution originating on the territory of a
non-contracting State. However, the said Party shall endeavor to cooperate with
the said State so as to make possible full application of the Protocol.
Article 12
SETTLEMENT OF DISPUTES
1. Taking into account article 28, paragraph 1, of the Convention, when land-based
pollution originating from the territory of one Party is likely to prejudice directly
the interests of one or more of the other Parties, the Parties concerned shall, at the
request of one or more of them, undertake to enter into consultation with a view to
seeking a satisfactory solution.
2. At the request of any Party concerned, the matter shall be placed on the agenda of
the next meeting of the Parties held in accordance with article 14 of this Protocol;
the meeting may make recommendations with a view to reaching a satisfactory
solution.
Article 13
REPORTS
The Parties shall submit reports every two years, unless decided otherwise by the
Meeting of the Contracting Parties, to the meetings of the Contracting Parties, through
the Organization, of measures taken, results achieved and, if the case arises, of
difficulties encountered in the application of this Protocol. Procedures for the
submission of such reports shall be determined at the meetings of the Parties. Such
reports shall include, inter alia:
203
204
Annex1
(a) Statistical data on the authorizations granted in accordance with article 6
of this Protocol;
(b) Data resulting from monitoring as provided for in article 8 of this Protocol;
(c) Quantities of pollutants discharged from their territories;
(d) Action plans, programmes and measures implemented in accordance with
articles 5, 7 and 15 of this Protocol.
Article 14
MEETINGS
1.
Ordinary meetings of the Parties shall take place in conjunction with
ordinary meetings of the Contracting Parties to the Convention held pursuant to
article 18 of the Convention. The Parties may also hold extraordinary meetings in
accordance with article 18 of the Convention.
2.
The functions of the meetings of the Parties to this Protocol shall be, inter
alia:
(a)
To keep under review the implementation of this Protocol and to consider
the efficacy of the action plans, programmes and measures adopted;
(b)
To revise and amend any annex to this Protocol, as appropriate;
(c)
To formulate and adopt action plans, programmes and measures
in accordance with articles 5, 7 and 15 of this Protocol;
(d)
To adopt, in accordance with article 7 of this Protocol, common
guidelines, standards or criteria, in any form decided upon by the
Parties;
(e)
To make recommendations in accordance with article 12, paragraph 2, of
this Protocol;
(f)
To consider the reports submitted by the Parties under article 13 of this
Protocol;
(g)
To discharge such other functions as may be appropriate for the
application of this Protocol.
Article 15
ADOPTION OF ACTION PLANS, PROGRAMMES AND MEASURES
204
205
Annex1
1. The meeting of the Parties shall adopt, by a two-thirds majority, the short-term
and medium-term regional action plans and programmes containing measures and
timetables for their implementation provided for in article 5 of this Protocol.
2. Regional action plans and programmes as referred to in paragraph 1 shall be
formulated by the Organization and considered and approved by the relevant
technical body of the Contracting Parties within one year at the latest of the entry
into force of the amendments to this Protocol. Such regional action plans and
programmes shall be put on the agenda for the subsequent meeting of the Parties
for adoption. The same procedure shall be followed for any additional action plans
and programmes.
3. The measures and timetables adopted in accordance with paragraph 1 of this
article shall be notified by the Secretariat to all the Parties. Such measures and
timetables become binding on the one hundred and eightieth day following the
day of notification for the Parties which have not notified the Secretariat of an
objection within one hundred and seventy-nine days from the date of notification.
4. The Parties which have notified an objection in accordance with the preceding
paragraph shall inform the meeting of the Parties of the provisions they intend to
take, it being understood that these Parties may at any time give their consent to
these measures or timetables.
Article 16
FINAL PROVISIONS
1. The provisions of the Convention relating to any Protocol shall apply with
respect to this Protocol.
2. The rules of procedure and the financial rules adopted pursuant to article
24 of the Convention shall apply with respect to this Protocol, unless the
Parties to this Protocol agree othe rwise.
3. This Protocol shall be open for signature, at Athens from 17 May 1980 to
16 June 1980, and at Madrid from 17 June 1980 to 16 May 1981, by any
State invited to the Conference of Plenipotentiaries of the Coastal States
of the Mediterranean Region for the Protection of the Mediterranean Sea
against Pollution from Land-Based Sources held at Athens from 12 May to
17 May 1980. It shall also be open until the same dates for signature by
the European Economic Community and by any similar regional economic
grouping of which at least one member is a coastal State of the
Mediterranean Sea Area and which exercises competence in fields covered
by this Protocol.
4. This Protocol shall be subject to ratification, acceptance or approval.
Instruments of ratification, acceptance or approval shall be deposited with
the Government of Spain, which will assume the functions of Depositary.
205
206
Annex1
5. As from 17 May 1981, this Protocol shall be open for accession by the
States referred to in paragraph 3 above, by the European Economic
Community and by any grouping referred to in that paragraph.
6. This Protocol shall enter into force on the thirtieth day following the
deposit of at least six instruments of ratification, acceptance or
approval of, or accession to, the Protocol by the Parties referred to in
paragraph 3 of this article.
IN WITNESS WHEREOF the undersigned, being duly authorized by their respective
Governments, have signed this Protocol.
DONE at Athens on 17 May 1980 and amended at Syracuse on 7 March 1996 in a
single copy in the Arabic, English, French and Spanish languages, the four
texts being equally authoritative.
ANNEX I
ELEMENTS TO BE TAKEN INTO ACCOUNT IN THE
PREPARATION OF ACTION
PLANS, PROGRAMMES AND MEASURES FOR THE ELIMINATION OF
POLLUTION FROM
LAND-BASED SOURCES AND ACTIVITIES
This annex contains elements which will be taken into account in the preparation of
action plans, programmes and measures for the elimination of pollution from
land-based sources and activities referred to in articles 5, 7 and 15 of this
Protocol.
Such action plans, programmes and measures will aim to cover the sectors of activity
listed in section A and also cover the groups of substances enumerated in
section C, selected on the basis of the characteristics listed in section B of the
present annex. Priorities for action should be established by the Parties, on the
basis of the relative importance of their impact on public health, the
environment and socio -economic and cultural conditions. Such programmes
should cover point sources, diffuse sources and atmospheric deposition.
In preparing action plans, programmes and measures, the Parties, in conformity with
the Global Programme of Action for the Protection of the Marine Environment
from Land-based Activities, adopted in Washington, D.C. in 1995, will give
priority to substances that are toxic, persistent and liable to bioaccumulate, in
particular to persistent organic pollutants (POPs), as well as to wastewater
treatment and management.
A. SECTORS OF ACTIVITY
The following sectors of activity (not listed in order of priority) will be primarily
considered when setting priorities for the preparation of action plans,
programmes and measures for the elimination of the pollution from land-based
sources and activities:
1. Energy production;
2. Fertilizer production;
3. Production and formulation of biocides;
4. The pharmaceutical industry;
5. Petroleum refining;
206
207
Annex1
6. The paper and paper-pulp industry;
7. Cement production;
8. The tanning industry;
9. The metal industry;
10. Mining;
11. The shipbuilding and repairing industry;
12. Harbour operations;
13. The textile industry;
14. The electronic industry;
15. The recycling industry;
16. Other sectors of the organic chemical industry;
17. Other sectors of the inorganic chemical industry;
18. Tourism;
19. Agriculture;
20. Animal husbandry;
21. Food processing;
22. Aquaculture;
23. Treatment and disposal of hazardous wastes;
24. Treatment and disposal of domestic waste water;
25. Management of municipal solid waste;
26. Disposal of sewage sludge;
27. The waste management industry;
28. Incineration of waste and management of its residues;
29. Works which cause physical alteration of the natural state of the coastline;
30. Transport.
B. CHARACTERISTICS OF SUBSTANCES IN THE ENVIRONMENT
For the preparation of action plans, programmes and measures, the
Parties should take into account the characteristics listed below:
1. Persistence;
2. Toxicity or other noxious properties (e.g. carcinogenicity, mutagenicity,
teratogenicity);
207
208
Annex1
3. Bioaccumulation;
4. Radioactivit y;
5. The ratio between observed concentrations and no observed effect
concentrations (NOEC);
6. The risk of eutrophication of anthropogenic origin;
7. Health effects and risks;
8. Transboundary significance;
9. The risk of undesirable changes in the marine ecosystem and irreversibility
or durability of effects;
10. Interference with the sustainable exploitation of living resources or with
other legitimate uses of the sea;
11. Effects on the taste and/or smell of marine products for human
consumption;
12. E ffects on the smell, colour, transparency or other characteristics of
seawater;
13. Distribution pattern (i.e. quantities involved, use patterns and probability
of reaching the marine environment).
C. CATEGORIES OF SUBSTANCES
The following categories of substances and sources of pollution will serve as guidance
in the preparation of action plans, programmes and measures:
1. Organohalogen compounds and substances which may form such
compounds in the marine environment. Priority will be given to Aldrin,
Chlordane, DDT, Dieldrin, Dioxins and Furans, Endrin, Heptachlor,
Hexachlorobenzene, Mirex, PCBs and Toxaphene;
2. Organophosphorus compounds and substances which may form such
compounds in the marine environment;
3. Organotin compounds and substances which may form such compounds in
the marine environment;
4. Polycyclic aromatic hydrocarbons;
5. Heavy metals and their compounds;
6. Used lubricating oils;
7. Radioactive substances, including their wastes, when their discharges do
not comply with the principles of radiation protection as defined by the
competent international organizations, taking into account the protection of
the marine environment;
8. Biocides and their derivatives;
9. Pathogenic microorganisms;
10. Crude oils and hydrocarbons of petroleum orig in;
11. Cyanides and fluorides;
12. Non-biodegradable detergents and other non-biodegradable surface-active
substances;
13. Compounds of nitrogen and phosphorus and other substances which may
cause eutrophication;
14. Litter (any persistent manufactured or processed solid material which is
discarded, disposed of, or abandoned in the marine and coastal environment);
15. Thermal discharges;
16. Acid or alkaline compounds which may impair the quality of water;
17. Non-toxic substances that have an adverse effect on the oxygen content of
the marine environment;
208
209
Annex1
18. Non-toxic substances that may interfere with any legitimate use of the
sea;
19. Non-toxic substances that may have adverse effects on the physical or
chemical characteristics of seawater.
ANNEX II
ELEMENTS TO BE TAKEN INTO ACCOUNT IN THE ISSUE OF THE
AUTHORIZATIONS
FOR DISCHARGES OF WASTES
With a view to the issue of an authorization for the discharges of wastes containing
substances referred to in article 6 to this Protocol, particular account will be
taken, as the case may be, of the following factors:
A. CHARACTERISTICS AND COMPOSITION OF THE DISCHARGES
1. Type and size of point or diffuse source (e.g. industrial process).
2. Type of discharges (e.g. origin, average composition).
3. State of waste (e.g. solid, liquid, sludge, slurry).
4. Total amount (volume discharged, e.g. per year).
5. Discharge pattern (continuous, intermittent, seasonally variable, etc.).
6. Concentrations with respect to relevant constituents of substances listed in
annex I and of other substances as appropriate. 7. Physical, chemical and
biochemical properties of the waste discharges.
B.
CHARACTERISTICS OF DISCHARGE CONSTITUENTS
WITH RESPECT TO THEIR HARMFULNESS
1. Persistence (physical, chemical, biological) in the marine environment.
2. Toxicity and other harmful effects.
3. Accumulation in biological materials or sediments.
4. Biochemical transformation producing harmful compounds.
5. Adverse effects on the oxygen content and balance.
6. Susceptibility to physical, chemical and biochemical changes and
interaction in the aquatic environment with other sea-water constituents which
may produce harmful biological or other effects on any of the uses listed in
section E below.
7. All other characteristics as listed in annex I, section B.
C. CHARACTERISTICS OF DISCHARGE SITE AND RECEIVING
ENVIRONMENT
209
210
Annex1
1. Hydrographic, meteorological, geological and topographical characteristics
of the coastal area.
2. Location and type of the discharge (outfall, canal outlet, etc.) and its
relation to other areas (such as amenity areas, spawning, nursery, and fishing
areas, shellfish grounds) and other discharges.
3. Initial dilution achieved at the point of discharge into the receiving
environment.
4. Dispersion characteristics such as effects of currents, tides and wind on
horizontal transport and vertical mixing.
5. Receiving water characteristics with respect to physical,
chemical, biological and ecological conditions in the discharge area.
6. Capacity of the receiving marine environment to receive waste discharges
without undesirable effects.
D. AVAILABILITY OF WASTE TECHNOLOGIES
The methods of waste reduction and discharge for industrial effluents as well as
domestic sewage should be selected taking into account the availability and
feasibility of:
(a) Alternative treatment processes;
(b) Re-use or elimination methods;
� On-land disposal alternatives;
(d) Appropriate low-waste technologies.
E. POTENTIAL IMPAIRMENT OF MARINE ECOSYSTEMS AND SEA-
WATER USES
1. Effects on human health through pollution impact on:
(a) Edible marine organisms;
(b) Bathing waters;
(c) Aesthetics.
2. Effects on marine ecosystems, in particular living resources, endangered species
and critical habitats.
3. Effects on other legitimate uses of the sea.
ANNEX III
CONDITIONS OF APPLICATION TO POLLUTION TRANSPORTED THROUGH
THE ATMOSPHERE
This annex defines the conditions of application of this Protocol to pollution from
land-based sources transported by the atmosphere in terms of Article 4.1(b)
are the following:
1. This Protocol shall apply to polluting discharges into the atmosphere under the
following conditions:
(a) the discharged substance is or could be transported to the Mediterranean
Sea Area under prevailing meteorological conditions;
(b) the input of the substance into the Mediterranean Sea Area is hazardous for
the environment in relation to the quantities of the same substance
reaching the Area by other means.
210
211
Annex1
2. This Protocol shall also apply to polluting discharges into the atmosphere
affecting the Mediter ranean Sea Area from land-based sources within the
territories of the Parties and from fixed man-made offshore structures, subject
to the provisions of article 4.2 of this Protocol.
3. In the case of pollution of the Mediterranean Sea Area from land-based
sources through the atmosphere, the provisions of articles 5 and 6 of this
Protocol shall apply progressively to appropriate substances and sources listed
in annex I to this Protocol as will be agreed by the Parties.
4. Subject to the conditions specifie d in paragraph 1 of this annex, the provisions
of Article 7.1 of this Protocol shall also apply to:
(a) discharges - quantity and rate - of substances emitted to the atmosphere, on
the basis of the information available to the Contracting Parties concernin g
the location and distribution of air pollution sources;
(b) the content of hazardous substances in fuel and raw materials;
(c) the efficiency of air pollution control technologies and more efficient
manufacturing and fuel burning processes;
(d) the application of hazardous substances in agriculture and forestry.
5. The provisions of annex II to this Protocol shall apply to pollution through the
atmosphere whenever appropriate. Air pollution monitoring and modelling
using acceptable common emission factors and methodologies shall be carried
out in the assessment of atmospheric deposition of substances, as well as in the
compilation of inventories of quantities and rates of pollutant emissions into
the atmosphere from land-based sources.
6. All Articles, including parts thereof to this Protocol not mentioned in
paragraphs 1 to 5 above shall apply equally to pollution from land-based
sources transported by the atmosphere wherever applicable and subject to the
conditions specified in paragraph 1 of this Annex.
ANNEX IV
CRITERIA FOR THE DEFINITION OF BEST AVAILABLE
TECHNIQUES AND BEST ENVIRONMENTAL PRACTICE
211
212
Annex1
A. BEST AVAILABLE TECHNIQUES
1. The use of the best available techniques shall emphasize the use of non-waste
technology, if available.
2. The term "best available techniques" means the latest stage of development
(state of the art) of processes, of facilities or of methods of operation which
indicate the practical suitability of a particular measure for limiting discharges,
emissions and waste. In determining whether a set of processes, facilities and
methods of operation constitute the best available techniques in general or
individual cases, special consideration shall be given to:
(a) comparable processes, facilities or methods of operation which have
recently been successfully tried out;
(b) technological advances and changes in scientific knowledge and
understanding;
(c) the economic feasibility of such techniques;
(d) time limits for installation in both new and existing plants;
(e) the nature and volume of the discharges and emissions concerned. 3. It
therefore follows that what is "best available techniques" for a particular
process will change with time in the light of technological advances, economic
and social factors, as well as changes in scientif ic knowledge and
understanding. 4. If the reduction of discharges and emissions resulting from
the use of best available techniques does not lead to environmentally acceptable
results, additional measures have to be applied. 5. "Techniques" include both
the technology used and the way in which the installation is designed, built,
maintained, operated and dismantled.
B. BEST ENVIRONMENTAL PRACTICE
6. The term "best environmental practice" means the application of the most appropriate
combination of environmental control measures and strategies. In making a selection
for individual cases, at least the following graduated range of measures should be
considered:
(a) the provision of information and education to the public and to users about the
environmental consequences of choice of particular activities and choice of
products, their use and ultimate disposal;
(b) the development and application of codes of good environmental practice which
cover all aspects of the activity in the product's life;
(c) the mandatory application of labels informing users of environmental risks
related to a product, its use and ultimate disposal;
(d) saving resources, including energy;
(e) making collection and disposal systems available to the public;
212
213
Annex1
(f) avoiding the use of hazardous substances or products and the generation of
hazardous waste;
(g) recycling, recovery and re-use;
(h) the application of economic instruments to activities, products or groups of
products;
(i) establishing a system of licensing, involving a range of restrictions or a ban.
7. In determining what combination of measures constitute best environmental practice,
in general or individual cases, particular consideration should be given to:
(a)the environmental hazard of the product and its production, use and ultimate
disposal;
(b) the substitution by less polluting activities or substances;
(c) the scale of use;
(d) the potential environmental benefit or penalty of substitute materials or activities;
(e) advances and changes in scientific knowledge and understanding;
(f) time limits for implementation;
(g) social and economic implications.
8. It therefore follows that best environmental practice for a particular source will
change with time in the light of technological advances, economic and social fac tors,
as well as changes in scientific knowledge and understanding. 9. If the reduction of
inputs resulting from the use of best environmental practice does not lead to
environmentally acceptable results, additional measures have to be applied and best
environmental practice redefined.
213
214
Annex1
Annex 4
Protocol on Protection of the Black Sea Marine Environment
Against Pollution from Land Based Sources
SIGNED 21 APR 1992, IN FORCE 1 9 9 4
ARTICLE 1
In accordance with Article VII of the Convention, the Contracting Parties shall take
all necessary measures to prevent, reduce and control pollution of the marine
environment of the Black Sea caused by discharges from land-based sources
on their territories such as rivers, canals, coastal establishments, other artificial
structures, outfalls or run-off, or emanating from any other land-based source,
including through the atmosphere.
Article 2
For the purposes of this Protocol, the fresh water limit means the landward part of the
line drawn between the endpoints on the right and the left banks of a
watercourse where it reaches the Black Sea.
Article 3
This protocol shall apply to the Black Sea as defined in Article I of the Convention
and to the waters landward of the baselines from which the breadth of the
territorial sea is measured and in the case of fresh-water courses, up to the
fresh-water limit.
Article 4
The Contracting Parties undertake to prevent and eliminate pollution of the marine
environment of the Black Sea from land-based sources by substances and
matter listed in Annex I to this Protocol.
The Contracting Parties undertake to reduce and, whenever possible, to eliminate
pollution of the marine environment of the Black Sea from land-based sources
by substances and matter listed in Annex II to this Protocol.
As to water courses that are tributaries to the Black Sea, the Contracting Parties will
endeavour to cooperate, as appropriate, with other States in order to achieve
the purposes set forth in this Article.
Article 5
Pursuant to the provisions of Article XV of the Convention, each Contracting Party
shall carry out, at the earliest possible date, monitoring activities in order to
assess the levels of pollution, its sources and ecological effects along its coast,
in particular with regard to the substances and matter listed in Annexes I and II
to this Protocol. Additional research will be conducted upstream of river
sections in order to investigate fresh/salt water interactions.
214
215
Annex1
Article 6
In conformity with Article XV of the Convention, the Contracting Parties shall
cooperate in elaborating common guidelines, standards or criteria dealing with
special characteristics of marine outfalls and in undertaking research on
specific requirements for effluents necessitating separate treatment and
concerning the quantities of discharged substances and matter listed in
Annexes I and II, their concentration in effluents, and methods of discharging
them.
The common emission standards and timetable for the implementation of the
programme and measures aimed at preventing, reducing or eliminating, as
appropriate, pollution from land-based sources shall be fixed by the
Contracting Parties and periodically reviewed for substances and matter listed
in Annexes I and II to this Protocol.
The Commission shall define pollution prevention criteria as well as recommend
appropriate measures to reduce, control and eliminate pollution of the marine
environment of the Black Sea from land-based sources.
The Contracting Parties shall take into consideration the following:
a) The discharge of water from municipal sewage systems should be made in
such a way as to reduce the pollution of the marine environment of the Black
Sea. b) The pollution load of industrial wastes should be reduced in order to
comply with the accepted concentrations of substances and matter listed in
Annexes I and II to this Protocol. c) The discharge of cooling water from
nuclear power plants or other industrial enterprises using large amounts of
water should be made in such a way as to prevent pollution of the marine
environment of the Black Sea. d) The pollution load from agricultural and
forest areas affecting the water quality of the marine environment of the Black
Sea should be reduced in order to comply with the accepted concentrations of
substances and matter listed in Annexes I and II to this Protocol.
Article 7
The Contracting Parties shall inform one another through the Commission of
measures taken, results achieved or difficulties encountered in the application
of this Protocol. Procedures for the collection and transmission of such
information shall be determined by the Commission.
215
216
Annex1
Annex I
Hazardous Substances and Matter
The following substances or groups of s ubstances or matter are not listed in order of
priority. They have been selected mainly on the basis of their toxicity,
persistence and bioaccumulation characteristics.
This Annex does not apply to discharges which contain substances and matter listed
below that are below the concentration limits defined jointly by the Contracting
Parties, not exceeding environmental background concentrations.
1. Organotin compounds.
2. Organohalogen compounds e. g.DDT, DDE, DDD, PCB's.
3. Persistent organophosphorus compounds.
4. Mercury and mercury compounds.
5. Cadmium and cadmium compounds.
6. Persistent substances with proven toxic carcinogenic, teratogenic or mutagenic
properties.
7. Used lubricating oils.
8. Persistent synthetic materials which may float, sink or remain in suspension.
216
217
Annex1
9. Radioactive substances and wastes, including used radioactive fuel. 10. Lead
and lead compounds.
Annex II
Noxious Substances and Matter
The following substances and matter have been selected mainly on the basis of
criteria used in Annex I, while taking into account the fact that they are less
harmful or more readily rendered harmless by natural processes.
The control and strict limitation of the discharges of substances and matter referred to
in this Annex shall be implemented in accordance with Annex III to this
Protocol.
1. Biocides and their derivatives not covered in Annex I.
2. Cyanides, flourides, and elemental phosphorus.
3. Pathogenic micro-organisms.
4. Nonbiodegradable detergents and their surface-active substances.
5. Alkaline or acid compounds.
6. Thermal discharges.
7. Substances which, although of a non-toxic nature, may become harmful to the
marine biota owing to the quantities in which they are discharged e. g.
inorganic phosphorous, nitrogen, organic matter and other nutrient compounds.
Also substances which have an adverse effect on the oxygen content in the
marine environment.
8. The following elements and their compounds:
Zinc, Selenium, Tin, Vanadium, Copper, Arsenic, Barium, Cobalt,
Nickel, Antimony, Beryllium, Thallium, Chromium, Molybdenum,
Boron, Tellurium, Titanium, Uranium, Silver.
9. Crude oil and hydrocarbons of any origin.
Annex III
The discharges of substances and matter listed in Annex II to this Protocol shall be
subject to restrictions based on the following:
1. Maximum permissible concentrations of the substances and matter immediate
before the outlet;
2. Maximum permissible quantity (load, inflow) of the substances and matter per
annual cycle or shorter time limit;
217
218
Annex1
3. In case of differences between 1 and 2 above, the stricter restriction should
apply.
When issuing a permit for the discharge of wastes containing
substances and matter referred to in Annexes I and II to this
Protocol, the national authorities will take particular account, as the
case may be, of the following factors:
A.
CHARACTERISTICS AND COMPOSITION OF THE WASTE
1. Type and size of waste source (e. g. industrial process).
2. Type of waste (origin, average composition).
3. Form of waste (solid, liquid, sludge, slurry).
4. Total amount (volume discharged. e. g. per year).
5. Discharge pattern (continuous, intermittent, seasonally variable, etc.).
6. Concentrations with respect to major constituents, substances listed in Annex I,
substances listed in Annex II, and other harmful substances as appropriate.
7. Physical, chemical and biological properties of the waste.
B.
CHARACTERISTICS OF WASTE CONSTITUENTS WITH
RESPECT TO
THEIR HARMFULNESS
1. Persistence (physical, chemical, biological) in the marine environment.
2. Toxicity and other harmful effects.
3. Accumulation in biological materials and sediments.
4. Biochemical transformation producing harmful compounds.
5. Adverse effects on the oxygen contents and balance.
6. Susceptibility to physical, chemical and biochemical changes and interaction in
the marine environment with other seawater constituents whic h may produce
harmful biological or other effects on any of the uses listed in section E below.
C.
CHARACTERISTICS OF DISCHARGE SITE AND
RECEIVING MARINE
ENVIRONMENT
1. Hydrographic, meteorological, geological and topographic characteristics of
the coastal ar ea.
218
219
Annex1
2. Location and type of discharge (outfall, canal, outlet, etc.) and its relation to
other areas (such as amenity areas, spawning, nursery and fishing areas,
shellfish grounds) and other discharges.
3. Initial dilution achieved at the point of discharge into the receiving marine
environment.
4. Dispersal characteristics such as the effect of currents, tides and winds on
horizontal transport and vertical mixing.
5. Receiving water characteristics with respect to physical, chemical, biological
and ecological conditions in the discharge area.
6. Capacity of the receiving marine environment to receive waste discharges
without undesirable effects.
D.
AVAILABILITY OF WASTE TECHNOLOGIES
The methods of waste reduction and discharge for industrial effluents as well as
household sewage should be selected taking into account the availability and
feasibility of:
a) Alternative treatment processes;
b) Recycling, re-use, or elimination methods;
c) On-land disposal alternatives; and
d) Appropriate clean and low -waste technologies.
E.
POTENTIAL IMPAIRMENT OF MARINE ECOSYSTEMS
AND SEA-WATER
USES
1. Effects on human life through pollution impact on:
a) Edible marine organisms;
b) Bathing waters;
c) Aesthetics.
Discharges of wastes containing substances and matter listed in
Annexes I and II shall be subject to a system of self-monitoring
and control by the competent national authorities.
219
220
Annex1
2. Effects on marine ecosystems, in particular living resources, endangered
species, and critical habitats.
3. Effects on other legitimate uses of the sea.
220
221
Annex1
Annex 5
DRAFT DRAFT DRAFT DRAFT DRAFT DRAFT DRAFT DRAFT
Draft Amended Protocol on Protection of the Black Sea Marine
Environment
Against Pollution from Land Based Sources
The Contracting Parties to the present Protocol,
Being Parties to the Convention on the Protection of the Black Sea Against Pollution,
signed at Bucharest on 21 Apr 1992 (Bucharest Convention),
Desirous of implementing the Convention, the Odessa Declaration and Strategic
Action Plan for the Rehabilitation and Protection of the Black Sea (BSSAP),
Recognizing the danger posed to the marine environment, living resources and human
health by pollution from land-based sources and activities
Also recognizing that eutrophication is a phenomenon, which occurs over wide areas
of the Black Sea and should be of concern to the countries of the Black Sea basin,
Applying the precautionary principle and the polluter pays principle, undertaking
environmental impact assessment and utilizing the best available techniques and the
best environmental practice,
including clean production technologies, as provided for in Black Sea Strategic
Action Plan,
Determined to take, nationally and in close cooperation, the necessary measures to
protect the Black Sea against pollution from land-based sources and activities,
especially to reduce input of nutrients,
Taking into consideration the Global Programme of Action for the Protection of the Marine
Environment from Land-Based Activities, adopted in Washington, D.C., on 3
November 1995,
Noting the European Union Directive on establishing a framework for Community action in
the field of water policy,
Recognizing the efforts of the Danube basin countries to reduce the pollution of their fresh
water resources,
Have agreed as follows:
221
222
Annex1
Article 1
GENERAL PROVISION
1. In accordance with Article VII of the Convention, the Contracting Parties shall
take all necessary measures to prevent, eliminate, reduce and control pollution of
the marine environment of the Black Sea caused by discharges from land-based
sources and activities on their territories
2. Special measures will be taken to reduce nutrient load to the Black Sea. With this
respect the Contracting Parties will promote cooperation among all Black Sea
basin states, and, in particular, between the Black Sea coastal states and the states
of the Danube river basin.
Article 2
DEFINITIONS
For the purposes of this Protocol:
(e) "The Convention" means the Convention on the Protection of the Black
Sea Against Pollution, signed at Bucharest on 21 Apr 1992 (Bucharest
Convention);
(f) "Commission" means the body referred to in article 17 of the
Convention;
(g) The "Hydrologic Basin" means the entire watershed area within the
territories of the Contracting Parties, draining into the Black Sea as
defined in article 1 of the Convention.
(h) "River basin" means the area of land from which all surface run-off
flows trough a sequent of streams, rivers and, possibly, lakes into the
sea at a single river moth, est uary or delta.
(i) "hot spots" means the dominant point sources of pollution on the coast
of the Black Sea identified within the frame of BSAP.and listed in the
Black Sea Transboundary Diagnostic Analysis (or in the Annex to this
Protocol)
(j) "combined approach to pollution control" means application of both:
i)emission standards to control emissions from individual point sources and
ii)environmental quality standards to limit the cumulative impact of such
emissions as well as of diffuse sources of pollution.
(k ) "River Basin District" means the administrative area of land and sea, made up
of one or more neighboring river basins together with their associated
groundwater and coastal waters
"Surface water" means surface fresh water, estuaries and coastal waters.
"Surface fresh water" means all static or flowing water on the surface of the land
upstream of the fresh water limit.
222
223
Annex1
"Fresh water limit" means the place in the watercourse where, at low tide
and in a period of low fresh water flow, there is an appreciable increase in
salinity due to presence of seawater.
"Coastal water" means water on the landward side of a line every point of
which is at a distance of one nautical mile on the seaward side from the
nearest point of the baseline from which the breadth of territorial waters is
measured, extending where appropriate in the case of watercourses, up to the
outer limit of the estuary.
"Estuary" means the transitional area at the mouth of the river between
surface fresh water and coastal waters. The outer (seaward) limits of
estuaries shall be defined, as necessary, by Member States. The inner
(upstream) limit shall be the fresh water limit.
.
Article 3
PROTOCOL AREA
The area to which this Protocol applies (hereinafter referred to as the "Protocol Area") shall
be:
(e)
The Black Sea as defined in article 1 of the Convention;
(f)
The hydrologic basin of the Black Sea ;
(g)
Coastal waters.
Article 4
PROTOCOL APPLICATION
4. This Protocol shall apply:
(c) To discharges originating from land-based point and diffuse sources and
activitie s within the territories of the Contracting Parties that may affect
directly or indirectly the Black Sea. These discharges shall include those
which reach the Black Sea through coastal disposals, rivers, outfalls, canals, or
other watercourses, including ground water flow, or through run-off and
disposal under the seabed with access from land;
(d) To inputs of polluting substances transported by the atmosphere to the Black
Sea from land-based sources or activities within the territories of the
Contracting Parties.
5. This Protocol shall also apply to polluting discharges from fixed man-made
offshore structures which are under the jurisdiction of a Party and which serve
purposes other than exploration and exploitation of mineral resources of the
continental shelf and the sea-bed and its subsoil.
223
224
Annex1
6. The Parties shall invite to cooperate in the implementation of the Protocol States
that are not parties to the Protocol and have in their territory parts of the river
basins of rivers discharging to the Black Sea. Special mechanism should be
established for cooperation with the Danube river basin countries.
Article 5
GENERAL OBLIGATIONS
1. The Contracting Parties undertake to prevent and eliminate pollution of the marine
environment of the Black Sea from land-based sources by substances and matter
listed in Annex I to this Protocol.
2. The Contracting Parties undertake to reduce and, whenever possible, to eliminate
pollution of the marine environment of the Black Sea from land-based sources by
substances and matter listed in Annex II to this Protocol.
3. To this end, they shall elaborate and implement, individually or jointly, as
appropriate, national and regional action plans and programmes, containing
measure and timetables for their implementation. A list of hot-spots (The poin t
sources listed in Annex L) shall provide the basis for the elaboration of national
strategies and timetables for realizing substantial reductions of inputs of pollutants
from point sources (hot-spots).
4. The measures refereed to in the paragraph 3 above should be based on the best
available techniques and the best environmental practice including, where
appropriate, clean production technologies and application of the Integrated
Coastal Zone Management, (taking into account the crireria set forth in Annex K).
5. A special mechanism shall be negotiated with all states located in the Danube
river basin to address the eutrophication problem in the Black Sea. The objective
of the mechanism shall be to achieve a progressive series of stepwise reductions
of nutrient loads, until agreed Black Sea water quality objectives are met.
Article 6
ADOPTION OF ACTION PLANS, PROGRAMMES AND MEASURES
1. The meeting of the Parties shall adopt, by a two-thirds majority, the short-
term and medium -term regional action plans and programmes containing
measures and timetables for their implementation provided for in article 5
of this Protocol.
224
225
Annex1
2. Regional action plans and programmes as referred to in paragraph 1 shall
be formulated by the Commission and considered and approved by the
relevant technical body of the Contracting Parties within one year at the
latest of the entry into force of the amendments to this Protocol. Such
regional action plans and programmes shall be put on the agenda for the
subsequent meeting of the Parties for adoption. The same procedure shall
be followed for any additional action plans and programmes.
3. The measures and timetables adopted in accordance with paragraph 1 of
this article shall be notified by the Commission to all the Parties. Such
measures and timetables become binding on the one hundred and eightieth
day following the day of notification for the Parties which have not
notified the Secretariat of an objection within one hundred and seventy-
nine days from the date of notification.
4. The Parties which have notified an objection in accordance with the
preceding paragraph shall inform the meeting of the Parties of the
provisions they intend to take, it being understood that these Parties may at
any time give their consent to these measures or timetables.
Article 7
FUNDING
1. In addition to the financial participation by the Contracting Parties in accordance
with Article 23 the Convention, the Commission may, in response to requests
from Contracting Parties, seek additional funds or other forms of assistance for
activities related to this Protocol. These funds may include voluntary contributions
for the achievement of specific objectives of this Protocol made by the
Contracting Parties, other governments and government agencies, international
organisations, non-governmental organisations, the private sector and individuals.
2. The Contracting Parties, taking into account their capabilities, shall endeavour as
far as possible to ensure that adequate financial resources are available for the
formulation and implementation of projects and programmes necessary to
implement this Protocol. To this end, the Contracting Parties shall:
(a)
promote the mobilisation of substantial financial resources,
including grants and concessional loans, from national, bilateral
and multilateral funding sources and mechanisms, including
multilateral financial institutions; and
(b)
explore innovative methods and incentives for mobilising and
channeling resources, including those of foundations, non-
governmental organisations and other private sector entities.
225
226
Annex1
3.
In keeping with its development priorities, policies and strategies, each
Contracting Party undertakes to mobilise financial resources to implement its
plans, programmes and measures pursuant to this Protocol.
Article 8
MONITORING
1. Pursuant to the provisions of Article XV of the Convention, each Contracting
Party shall carry out monitoring activities, if necessary in cooperation with the
competent international organizations, in order to assess the levels of pollution, its
sources and ec ological effects along its coast, in particular with regard to the
substances and matter listed in Annexes I and II to this Protocol.
2. Additional research and monitoring will be conducted upstream of river sections
in order to investigate fresh/salt water interactions. More attention shall be
focussed on the issue of airborne pollutants, particularly those that involve
transboundary movements, as well as appropriate measures for controlling them at
source.
3. Monitoring shall also provide for evaluation of the effectiveness of action plans,
programmes and measures implemented under this Protocol to eliminate to the
fullest possible extent pollution of the marine environment.
Article 9
COMMON GUIDELINES AND STANDARDS
1. In conformity with Article XV of the Convention, the Contracting Parties shall
cooperate in elaborating common guidelines, standards or criteria dealing with
special characteristics of marine outfalls and in undertaking research on specific
requirements for effluents necessitating separate treatment and concerning the
quantities of discharged substances and matter listed in Annexes I and II, their
concentration in effluents, and methods of discharging them.
2. The regional action plans and programmes referred to in article 5 of this Protocol
shall be elaborated and implemented on the basis of the combined approach to
pollution control taking into consideration the following:
(a) The common emission standards and timetable for the implementation
of the programme and measures aimed at preventing, reducing or
eliminating, as appropriate, pollution from land-based sources shall be
fixed by the Contracting Parties and periodically reviewed for
substances and matter listed in Annexes I and II to this Protocol.
(b) The Commission shall define pollution prevention criteria as well as
recommend appropriate measures to reduce, control and eliminate
pollution of the marine environment of the Black Sea from land- based
sources.
226
227
Annex1
3. The Contracting Parties shall take into consideration the following:
(a)The discharge of water from municipal sewage systems should be made in such
a way as to reduce the pollution of the marine environment of the Black Sea.
(b)The pollution load of industrial wastes should be reduced in order to comply
with the accepted concentrations of substances and matter listed in Annexes I and
II to this Protocol.
(c)The discharge of cooling water from nuclear power plants or other industrial
enterprises using large amounts of water should be made in such a way as to
prevent pollution of the marine environment of the Black Sea.
(d)The pollution load from agricultural and forest areas affecting the water quality
of the marine environment of the Black Sea should be reduced in order to comply
with the accepted concentrations of substances and matter listed in Annexes I and
II to this Protocol.
4. The Commission shall prepare through its techical bodies a cod of a good
agricultural practice and a cod of conduct in the coastal zone for the Black Sea
reagion. The cods shall be adopted by the participating countries and
recommended for implemetation.
Article 10
AUTHORIZATION OR REGULATION SYSTEM
1. Point source discharges into the Protocol Area, and releases into water or air that
reach and may affect the Black Sea shall be strictly subject to authorization or
regulation by the competent authorities of the Parties, taking due account of the
provisions of this Protocol and the relevant decisions or recommendations of the
meetings of the Contracting Parties.
2. To this end, the Parties shall provide for systems of inspection by their competent
authorities to assess compliance with authorizations and regulations.
3. The Parties may be assisted by the Commission, upon request, in establishing
new, or strengthening existing, competent structures for inspection of compliance
with authorizations and regulations. Such assistance shall also include special
training of personnel.
4. The Parties establish appropriate sanctions in case of non-compliance with the
authorizations and regulations and ensure their application.
227
228
Annex1
Article 11
REPORTS
The Contracting Parties shall inform one another through the Commission of
measures taken, results achieved or difficulties encountered in the application
of this Protocol. The reports shall be submitted every two years, unless
decided otherwise by the Meeting of the Contracting Parties. Such reports
shall include, inter alia:
(a) Statistical data on the authorizations granted in accordance with article
8 of this Protocol;
(b) Data resulting from monitoring as provided for in article 6 of this Protocol;
(c) Qua ntities of pollutants discharged from their territories;
(d) Action plans, programmes and implemented measures.
Article 12
MEETINGS
Ordinary meetings of the Parties shall take place in conjunction with ordinary
meetings of the Contracting Parties to the Convention. The Parties may also
hold extraordinary meetings. The functions of the meetings of the Parties to
this Protocol shall be, inter alia:
(a) To keep under review the implementation of this Protocol and to consider the
efficacy of the action plans, progr ammes and measures adopted;
(b) To revise and amend any annex to this Protocol, as appropriate;
To formulate and adopt action plans, programmes and measures;
(c) To adopt, in accordance with article 7 of this Protocol, common guidelines,
standards or criteria, in any form decided upon by the Parties;
(d) To consider the reports submitted by the Parties under article 9 of this Protocol;
(e) To discharge such other functions as may be appropriate for the application of
this Protocol.
Annex I
Hazardous Substances and Matter
228
229
Annex1
The following substances or groups of substances or matter are not listed in order of
priority. They have been selected mainly on the basis of their toxicity,
persistence and bioaccumulation characteristics.
This Annex does not apply to discharges which contain substances and matter listed
below that are below the concentration limits defined jointly by the Contracting
Parties, not exceeding environmental background concentrations.
10. Organotin compounds.
11. Organohalogen compounds e. g. DDT, DDE, DDD, PCB's.
12. Persistent organophosphorus compounds.
13. Mercury and mercury compounds.
14. Cadmium and cadmium compounds.
15. Persistent substances with proven toxic carcinogenic, teratogenic or mutagenic
properties.
16. Used lubricating oils.
17. Persistent synthetic materials, which may float, sink or remain in suspension.
18. Radioactive substances and wastes, including used radioactive fuel. 10. Lead
and lead compounds.
Annex II
Noxious Substances and Matter
The following substances and matter have been selected mainly on the basis of
criteria used in Annex I, while taking into account the fact that they are less
harmful or more readily rendered harmless by natural processes.
The control and strict limitation of the discharges of substances and matter referred to
in this Annex shall be implemented in accordance with Annex III to this
Protocol.
1. Biocides and their derivatives not covered in Annex I.
9. Cyanides fluorides, and elemental phosphorus.
10. Pathogenic micro-organisms.
11. Nonbiodegradable detergents and their surface-active substances.
12. Alkaline or acid compounds.
229
230
Annex1
13. Thermal discharges.
14. Substances which, although of a non-toxic nature, may become harmful to the
marine biota owing to the quantities in which they are discharged e. g.
inorganic phosphorous, nitrogen, organic matter and other nutrient compounds.
Also substances which have an adverse effect on the oxygen content in the
marine environment.
15. The following elements and their compounds:
Zinc, Selenium, Tin, Vanadium, Copper, Arsenic, Barium, Cobalt,
Nickel, Antimony, Beryllium, Thallium, Chromium, Molybdenum,
Boron, Tellurium, Titanium, Uranium, Silver.
9. Crude oil and hydrocarbons of any origin.
Annex III
The discharges of substances and matter listed in Annex II to this Protocol shall be
subject to restrictions based on the following:
1. Maximum permissible concentrations of the substances and matter immediate
before the outlet;
2. Maximum permissible quantity (load, inflow) of the substances and matter per
annual cycle or shorter time limit;
3. In case of differences between 1 and 2 above, the stricter restriction should
apply.
When issuing a permit for the discharge of wastes containing
substances and matter referred to in Annexes I and II to this
Protocol, the national authorities will take particular account, as the
case may be, of the following factors:
A.
CHARACTERISTICS AND COMPOSITION OF THE WASTE
8. Type and size of waste source (e. g. industrial process).
9. Type of waste (origin, average composition).
10. Form of waste (solid, liquid, sludge, slurry).
11. Total amount (volume discharged. e. g. per year).
12. Discharge pattern (continuous, intermittent, seasonally variable, etc.).
13. Concentrations with respect to major constituents, substances listed in Annex I,
substances listed in Annex II, and other harmful substances as appropriate.
14. Physical, chemical and biological properties of the waste.
230
231
Annex1
B.
CHARACTERISTICS OF WASTE CONSTITUENTS WITH
RESPECT TO
THEIR HARMFULNESS
7. Persistence (physical, chemical, biological) in the marine environment.
8. Toxicity and other harmful effects.
9. Accumulation in biological materials and sediments.
10. Biochemical transformation producing harmful compounds.
11. Adverse effects on the oxygen contents and balance.
12. Susceptibility to physical, chemical and biochemical changes and interaction in
the marine environment with other seawater constituents which may produce
harmful biological or other effects on any of the uses listed in section E below.
C.
CHARACTERISTICS OF DISCHARGE SITE AND
RECEIVING MARINE
ENVIRONMENT
7. Hydrographic, meteorological, geological and topographic characteristics of
the coastal area.
8. Location and type of discharge (outfall, canal, outlet, etc.) and its relation to
other areas (such as amenity areas, spawning, nursery and fishing areas,
shellfish grounds) and other discharges.
9. Initial dilution achieved at the point of discharge into the receiving marine
environment.
10. Dispersal characteristics such as the effect of currents tide and winds on
horizontal transport and vertical mixing.
11. Receiving water characteristics with respect to physical, chemical, biological
and ecological conditions in the discharge area.
12. Capacity of the receiving marine environment to receive waste discharges
without undesirable effects.
D.
AVAILABILITY OF WASTE TECHNOLOGIES
The methods of waste reduction and discha rge for industrial effluents as well as
household sewage should be selected taking into account the availability and
feasibility of:
e) Alternative treatment processes;
f) Recycling, re-use, or elimination methods;
231
232
Annex1
g) On-land disposal alternatives; and
h) Appropriate clean and low -waste technologies.
E.
POTENTIAL IMPAIRMENT OF MARINE ECOSYSTEMS
AND SEA-WATER
USES
1. Effects on human life through pollution impact on:
d) Edible marine organisms;
e) Bathing waters;
f) Aesthetics.
Discharges of wastes containing substances and matter listed in
Annexes I and II shall be subject to a system of self-monitoring
and control by the competent national authorities.
2. Effects on marine ecosystems, in particular living resources, endangered
species, and critical habitats.
3. Effects on other legitimate uses of the sea.
232
233
Annex1
ENHANCEMENT OF THE LEGISLATIVE PROVISIONS FOR REDUCTION OF
NUTRIENTS INPUT TO THE BLACK SEA.
I. Introduction
Eutrophication and lack of effective management, control and regulation of water
bodies basins are Common Problems of the European Seas. (EUROPE'S
ENVIRONMENT: The Dobr�s Assessment. Edited by David Stanners and Philippe
Bourdeau. EEA, Copenhagen, 1995, pp.111-113). In the Black Sea region these
problems are aggravated by the unfavorable natural features of the sea:
(a) considerable isolation from the world ocean (retention time is 140
years);
(b) large area occupied by the northwestern continental shelf (about 25%
of a sea surface area) receiving the balk of the nutrients; and
(c) an extensive catchment area (over 1,700 000 km� versus 423,000 km�
the surface area of the sea itself).
Almost 87% of the Black Sea water volume is anoxic containing high levels of
hydrogen sulfide and methane and only 13% contain oxygen. The recent
anthropogenic pressure has placed even this 13% under serve stress. This stress is,
first of all, due to large input of nutrients.
Concerned about the state of the Black Sea ecosystem and the limited recovery of its
resources the Black Sea countries negotiated "Convention for the Protection of the
Black Sea against Pollution" that was signed in Bucharest in April 1992, and ratified
by all six legislative assemblies by early 1994. Convention includes a basic
framework of agreement and the following three specific Protocols:
(a) Protocol on Protection of the Black Sea Marine Environment against
Pollution from Land Based Sources (LBS);
(b) Protocol on Cooperation in Combating Pollution of the Black Sea
Marine Environment by Oil and other Harmful Substances in
Emergency Situations;
(c) Protocol on the Protection of the Black Sea Marine Environment
against Pollution by Dumping.
The goals, priorities and timetable needed to bring about environmental actions are set
in the Ministerial Declaration on the Protection of the Black Sea Environment. The
Declaration was signed by all six Ministers of the Environment in Odessa in April
1993.
In order to start the actual environmental cooperation in the region and to develop a
longer-term Action Plan, the Black Sea countries requested support from the Global
Environment Facility, GEF, a fund established in 1991 under the management of the
World Bank, UNDP and UNEP. In June 1993, a three-year Black Sea Environmental
Programme (BSEP) was established with US$ 9.3 million funding from GEF and
collateral funding from the European Union (Phare and Tacis), The Netherlands,
France, Austria, Canada and Japan. The most important achievements of BSEP were
Transboundery Diagnostic Analyses (TDA) and the regional Strategic Action Plan for
the Rehabilitation and Protection of the Black Sea (BS-SAP) adopted on 31 October
233
234
Annex1
1996. UNEP's contribution to the international effort in supporting environmental
cooperation in the Black Sea region contains in Annex 1.
The BS-SAP revealed that the Black Sea ecosystem continues to be threatened by
inputs of certain pollutants, notably nutrients. Nutrients enter the Black Sea from
land-based sources, and in particular through rivers. The Danube accounts for well
over half of the nutrient input to the Black Sea. Eutrophication is a phenomenon,
which occ urs over wide areas of the Black Sea and should be of concern to the
countries of the Black Sea basin. The BS-SAP calls for the development of a Black
Sea Basin Wide Strategy to address the eutrophication problem in the Black Sea. The
objective of the Stra tegy should be to negotiate, with all states located in the Black
Sea Basin, a progressive series of stepwise reductions of nutrient loads, until agreed
Black Sea water quality objectives are met.
.All six coastal countries on the basis of the BS-SAP drafted National Black Sea
Strategic Action Plans (NBS-SAPs), which are currently in the process of adoption.
The Bucharest Convention, BS-SAP and NBS-SAPs provide for policy and legal
basis for rehabilitation and protection of the Black Sea ecosystem and the sustainable
use of its resources. As a follow-up to these documents the GEF Nutrient Reduction
Programme was suggested in line with the GEF programmatic approach. It should
assist in implementation of the further concrete actions at national and regional levels
to combat eutrophication. Within the Programme UNEP was requested to assist the
Black Sea countries for a revision of the Protocol on Protection of the Black Sea
Marine Environment against Pollution from Land Based Sources.
This report is prepared to start the process of the requested assistance. It consists of
description of the recent international developments in combating pollution from
Land Based Sources, main elements suggested for amendments of the Protocol and an
outline of the actions, which UNEP plans to undertake. The report is prepared by a
UNEP consultant. It will be used for the preparation of a UNEP Regional project
component of the GEF Project Brief: "Nutrient Reduction Programme � Regional
Project for the Black Sea".
II. An objective of the revision of the Protocol and main elements suggested for
amendments.
The main objective of the revision of the Protocol should be to enhance its legislative
provisions for measures to reduce nutrient inputs to the Black Sea incorporating
relevant positions of the BS-SAP and the recent international developments in
combating pollution from Land Based Sources.
RECENT INTERNATIONAL DEVELOPMENTS IN COMBATING
POLLUTION FROM LBS.
Global Programme of Action for the Protection of the Marine Environment
fro m Land-based Activities.
The representatives of Governments and the European Commission, participating in
the Conference held in Washington from 23 October to 3 November 1995, recognized
the growing and serious threat from land-based activities to both human health and
well being and adopted Global Programme of Action for the Protection of the Marine
Environment from Land-based Activities (GPA) and the Washington Declaration.
The Global Programme of Action aims at preventing the degradation of the marine
environment from land-based activities by facilitating the realization of the duty of
States to preserve and protect the marine environment. It is designed to assist States in
234
235
Annex1
taking actions individually or jointly within their respective policies, prioritie s and
resources, which will lead to the prevention, reduction, control and/or elimination of
the degradation of the marine environment, as well as to its recovery from the impacts
of land-based activities. The Programme of Action, therefore, is designed to be a
source of conceptual and practical guidance to be drawn upon by national and/or
regional authorities in devising and implementing sustained action to prevent, reduce,
control and/or eliminate marine degradation from land-based activities. Effective
implementation of this Programme of Action is a crucial and essential step forward in
the protection of the marine environment and will promote the objectives and goals of
sustainable development.
The Global Programme of Action reflects the fact that States face a growing number
of commitments flowing from Agenda 21 and related conventions. Its implementation
will require new approaches by, and new forms of collaboration among,
Governments, organizations and institutions with responsibilities and expertise
relevant to marine and coastal areas, at all levels-national, regional and global. These
include the promotion of innovative financial mechanisms to generate needed
resources.
GPA recommends approaches to the prevention of pollution from land-based
activities by source category. It provides guidance as to the actions that States should
consider at national, regional and global levels to reduce and prevent inputs to the
marine environment of several categories of pollutants including nutrients. In the next
two years the Programme will concentrate upon implementation of the GPA Strategic
Action Plan on Municipal Wastewater as a part of the preparatory process for the
2001 Intergovernmental review of the GPA.
The Washington Declaration calls for the regional cooperation to coordinate efforts
for maximum efficiency and to facilitate action at the national level, including, where
appropriate, becoming parties to and strengthening regional cooperative agreements
and creating new agreements where necessary. The Protocol on Protection of the
Black Sea Marine Environment against Pollution from Land Based Sources is one of
such regional cooperative agreements and might be strengthened incorporating
commitments of the Black Sea governments took in Washington in 1995. The part III
"Regional Cooperation" of the GPA contains the most useful ideas, which might be
used as a conceptual and practical guidance for the amendment of the Protocol and its
annexes. In particular, the following requirements are relevant:
15.1 States should strengthen existing regional conventions and programmes, and
their institutional arrangements in particular:
(a) Invite multilateral financing agencies, including regional development banks,
and national institutions for bilateral development cooperation to cooperate in
programming and in national implementation of regional agreements.
(b) National action strategies and programmes can sometimes be best developed
in a regional and subregional context.
(c) The programmes of action should be developed and implemented on a
timetable appropriate to regional or subregional circumstances and decided
upon by the governing bodies of the regional or subregional agreements,
conventions or arrangements as appropriate;
(d) Establish or strengthen regional information networks and linkages for
communicating with clearing-houses and other sources of information;
235
236
Annex1
(e) Ensure close collaboration between the national and regional focal points and
regional economic groupings, other relevant regional and international
organizations, development banks and regional rivers authorities /
commissions, in the development and implementation of regional programmes
of action;
(f) Encourage and facilitate cooperation between and among regional
organizations / conventions to promote the exchange of information,
experience and expertise;
(g) Ensure that there is adequate secretariat support for regional and subregional
arrangements (legal agreements and programmes of action), including:
� Clear definition of secretariat functions and responsibilities;
� Consolidation of secretariats, including reliance on existing
institutional arrangements, where cost-effective;
� Cooperation between secretariats;
� Close integration of regional and subregional programmes of action
and the relevant lega l agreements that apply to the region and
subregion.
15.2 In the development and implementation of the regional programmes of action,
consideration should also be given to the following:
(a) Steps towards harmonization of environmental and control standards for
emissions and discharges of pollutants, and agreement on data -quality
assurance standards, data validation, comparative analysis, reference methods
and training that are required for reliable monitoring and assessment carried
out for the protection of the marine environment from land-based activities;
(b) Exploring the use of innovative financing mechanisms that will assist the
implementation of national and regional programmes of action;
(c) Building capacity and, where appropriate, identifying regional centers of
excellence for research, management tools and concepts, training and
capacity-building as well as contingency-planning, monitoring and
assessment, including environmentally sound technology assessment;
(d) Arrangements to ensure that decision-making at the regional level is based on
an integrated planning and management approach adopted at the national
level;
(e) Steps to protect critical habitats and endangered species;
(f) Establishment of linkages with regional or subregional fisheries arrangements,
as well as other mechanisms dealing with conservation of marine species, to
promote collaboration in the exchange of data and information and mutual
reinforcement in the achievement of respective objectives.
The above ideas and guidance were used in many practical arrangements
for protection of marine environment at the regional scale. The
recommendations to explore the use of innovative financing mechanisms
236
237
Annex1
for assistance of implementation of national and regional programmes of
actions has been realized in the Protocol Concerning Pollution from
Land-Based Sources and Activities to the Convention for the Protection
and Development of the Marine Environment of the Wider Caribbean
Region. The Protocol was adopted by the Conference of Plenipotentiaries
held in Oranjestad, Aruba, between 27 September and 6 October 1999
and stipulated that:
16.1 In addition to the financial participation by the Contracting Parties in
accordance with Article 23 the Convention, the Commission may, in response
to requests from Contracting Parties, seek additional funds or other forms of
assistance for activities related to this Protocol. These funds may include
voluntary contributions for the achievement of specific objectives of this
Protocol made by the Contracting Parties, other governments and government
agencies, international organizations, non-governmental organizations, the
private sector and individuals.
16.2 The Contracting Parties, taking into account their capabilities, shall
endeavor as far as possible to ensure that adequate financial resources
are available for the formulation and implementation of projects and
programmes necessary to implement this Protocol. To this end, the
Contracting Parties shall:
(c)
promote the mobilization of substantial financial resources,
including grants and concessional loans, from national, bilateral
and multilateral funding sources and mechanisms, including
multilateral financial institutions; and
(d)
explore innovative methods and incentives for mobilizing and
channeling resources, including those of foundations, non-
governmental organizations and other private sector entities.
16.3 In keeping with its development priorities, policies and strategies, each
Contracting Party undertakes to mobilize financial resources to implement its
plans, programmes and measures pursuant to this Protocol.
GPA also suggests that:
17.1 Land-locked States whose river systems and drainage basins are linked
to a particular marine region or subregion should be encouraged to participate
in the relevant regional and subregional arrangements; and
17.2 States should encourage, where appropriate, regions to enter into
interregional cooperation in order to exchange experiences and to help
implement policies. Interregional cooperation may also be necessary to
promote coordination of efforts for the protection and preservation of marine
ecosystems and habitats.
UNEP Regional Seas Programme and amended Protocol for the Protection of the
Mediterranean Sea against Pollution from Land-Based Sources and Activities.
In 1974 UNEP initiated the Regional Seas Programme as a global
programme implemented through regional components. At present it
includes 13 regions and has over 140 coastal States and Territories
participating in it. All programmes have developed and approved their
action plans in one or another form. Each regional action plan is
237
238
Annex1
formulated according to the needs of the region as perceived by the
Governments concerned. The action plans promote the parallel
development of regional legal framework agreements and of action-
oriented programme activities. The first action plan approved within the
Regional Seas Programme was the Mediterranean Action Plan (MAP).
MAP was adopted in Barcelona, Spain in 1975 under the auspices of the
United Nations Environment Programme (UNEP). It aims to protect the
environment and to foster development in the Mediterranean Basin. The
European participating countries are listed in Annex 2. Algeria, Egypt,
Lebanon, Morocco, Syria, Tunisia, and the European Commission also
participate. The MAP legal framework comprises the Barcelona
Convention and six Protocols covering specific aspects of environmental
protection. Since its adoption by all Mediterranean states and the EC, the
Action Plan has served as the basis for the development of a
comprehensive, environment and development programme in the region
involving the Mediterranean coastal states, specialized organizations of
the United Nations system, Intergovernmental and Non-governmental
Programmes and Organizations.
The Contracting Parties to the Barcelona Convention (the Mediterranean
States and the European Union) meet every two years on a Ministerial
level, to deliberate on general policy, strategy and political issues relevant
to their cooperation as well as to decide on MAP's programme and
budget. They keep their legal instruments up to date through constant
reviewing and amending them. The Protocol for the Protection of the
Mediterranean Sea against Pollution from Land-Based Sources and
Activities (see Annex 3) was adopted in Athens on 17 May 1980, entered
into force on 17 June 1983. and amended in Syracusa, Italy in March
1996.
The Protocol may serve as a good example for the amendemnt of the
Black Sea LBS Protocol due to the following reasons:
(a) it was amended to incorporate new developments, in particular to apply
the precautionary principle and the polluter pays principle and to take into
consideration the Global Programme of Action for the Protection of the
Marine Environment from Land-Based Activities;
(b) the Mediterranean and Black Sea regions are very close geographically;
and in general
(c) the legal instruments developed in the Mediterranean region often service
as a model for other regions within UNEP Regional Seas Programme.
The following elements might be considered for incorporation into the
amended Black Sea LBS Protocol:
22.1 In "General Provision" the Contracting Parties committed
themselves to take all appropriate measures to eliminate pollution
along with the prevention, abatement and combating.
238
239
Annex1
22.2 The important defin ition of a "Hydrologic Basin" extends the
Protocol area application to the entire watershed area within the
territories of the Contracting Parties, draining into the
Mediterranean Sea.
22.3 The sources to which the Protocol is applied are extended
and well defined.
22.4 The contracting parties committed themselves to the
preparation and implementation of national and regional action
plans and programmes, containing inter alia, binding measures and
timetables for their implementations. The action plans should be
adopted and periodically reviewed by the Parties. The elements of
the action plans and criteria for their adoption are set forth in
annexes to the Protocol.
22.5 The Parties shall submit reports every two years to the
meeting of the Contracting Parties. Such reports shall include, inter
alia:
(a) Statistical data on the authorizations granted in accordance
with the Protocol;
(b) Data resulting from monitoring as provided for in the Protocol;
(c) Quantities of pollutants discharged from their territories;
(d)Ac tion plans, programmes and measures implemented in
accordance with the Protocol.
22.6 The meeting of the Parties shall adopt, by a two-thirds
majority, the short-term and medium-term regional action plans and
programmes containing measures and timetables for their
implementation. Such measures and timetables become binding on
the one hundred and eightieth day following the day of notification.
As we mentioned earlier in the UNEP Regional Seas Programme has a
good experience in the financial issue. The Parties to the Convention for
the Protection and Development of the Marine Environment in the Wider
Caribbean Region, (done at Cartagena de Indias, Colombia on 24 March
1983) have adopted recently an LBS Protocol, which contains many
useful clauses especially on financial matter. The details were discussed
above.
European Union Water Framework Directive.
The European Union (EU) is the result of a process of cooperation and
integration which began in 1951. The EU today has fifteen Member
States (Austria, Belgium, Denmark, Finland, France, Germany, Greece,
Ireland, Italy, Luxembourg, the Netherlands, Portugal, Spain, Sweden,
and the United Kingdom) and is preparing for its fifth enlargement, this
time towards Eastern and Southern Europe. The process of enlargement
of the European Union was launched on 30 March 1998. Negotiations are
239
240
Annex1
currently being held with the following twelve applicants: Bulgaria,
Cyprus, the Czech Republic, Estonia, Hungary, Latvia, Lithuania, Malta,
Poland, Romania, Slovakia and Slovenia. Foe the purpose of this report
we prepared a table showing participation of the European countries in
the main international conventions on protection of water bodies. The
table also includes information on the bordering seas and catchments
basins, which includes the whole or part of the territory of the country.
The table is annexed to this report as Annex 2. As it follows from this
annex three EU members and seven applicants have the whole or the part
of their territories within the Black Sea Basin mainly in the Danube basin.
Some 58% of the total nitrogen and 66% of the total phosphorus flowing
in dissolved form into the Black Sea come from the Danube basin.
Therefore, the European Union policy on the protection, management,
control and regulation of water bodies has a direct impact for the state of
the Black Sea environment. The most of the EU's water legislation will
be rationalized with the adoption of the new European Parliament and
Council Directive establishing a framework for Community action in the
field of water policy (EU Directive). It was recently approved by the
Conciliation Committee between the Council and the European
Parliament.
The Directive aims to protect the inland surface water, transitional waters,
coastal waters and groundwater. As a result of the new directive, EU
member states will have to clean up their waters achieving good surface
water status by 31 December 2010. The Directive will also have a serious
impact on industry and agriculture.
The Directive will provide an overall framework within which national
governments and regional institutions can develop integrated and
coherent water policies. Of considerable interest, with respect to purposes
of this report, is that it is proposed to achieve the Directive's objectives
through the principle use of Rive Basin Management. Not only will this
include the area of land surface run-off to the estuary but will include
groundwater and coastal waters.
The following provisions of the Directive are of special interest:
28.1 Definitions:
� "Surface water" means surface fresh water, estuaries and coastal waters.
� "Surface fresh water" means all static or flowing water on the surface
of the land upstream of the fresh water limit.
� "Fresh water limit" means the place in the watercourse where, at low
tide and in a period of low fresh water flow, there is an appreciable
increase in salinity due to presence of seawater.
� "Coastal water" means water on the landward side of a line every point
of which is at a distance of one nautical mile on the seaward side from
the nearest point of the baseline from which the breadth of territorial
240
241
Annex1
waters is measured, extending where appropriate in the case of
watercourses, up to the outer limit of the estuary.
� "Estuary" means the transitional area at the mouth of the river between
surface fresh water and coastal waters. The outer (seaward) limits of
estuaries shall be defined, as necessary, by Member States. The inner
(upstream) limit shall be the fresh water limit.
� "River basin" means the area of land from which all surface run-off
flows trough a sequent of streams, rivers and, possibly, lakes into the
sea at a single river moth, estuary or delta.
� "River Basin District" means the administrative area of land and sea,
made up of one or more neighboring river basins together with their
associated groundwater and coastal waters.
28.2 Each Member State will have to identify individual river basins lying
within their national territories and assign them to a river basin district that
should include relevant groundwater, and coastal waters. In those rivers,
which cross national boundaries, it is intended to set up international river
basin districts.
28.3 For each river basin district � some of which will transcend national
frontiers � "a river basin management plan" will need to be established and
regularly updated.
28.4 Central to each river basin management plan will be the requirement for
Member States to establish a programme of measures to ensure that all waters
in the river basin achieve the objective of good water status.
The Directive takes a combined approach to pollution control, requiring
Member States to set down in their programmes of measures both limit
values to control emissions from individual point sources and
environmental quality standards to limit the cumulative impact of such
emissions as well as of diffuse sources of pollution.
Member States shall ensure the establishment of a register of all areas
lying within each river basin district which have been designated as
requiring special protection under specific Community, national or local
legislation for the protection of their surface water and groundwater or for
the conservation of habitats and species. Within each river basin district,
the register of protected areas shall be kept under review and up to date.
The Directive is the first piece of EU water legislation to address the
issue of water quantity. It stipulates that the programme of measures
established for each river basin district must aim to ensure a balance
between the abstraction and recharge of groundwater. Moreover, all
abstraction of surface water or groundwater will require prior
authorization except in areas where it can be demonstrated that this will
have no significant impact on the status of the water.
MAIN ELEMENTS TO BE INCLUDED IN THE AMENDED
PROTOCOL.
241
242
Annex1
Provisions for the development and implementation of a Black Sea
basin wide approach.
The need for an integrated approach to the management of the marine and
coastal environment, including associated river basins and groundwater
systems, are among the main issues emerged during the last decade on the
global scale. The above analyses of the recent international developments
in combating pollution from Land Based Sources support this statement.
The integrated approach is especially important for the Black Sea due to
its extensive drainage basin and large number of incoming rivers. The
following table shows the major rivers of the Black Sea basin:
Name
Cathment
Length,
Total Runoff
Sediment Discharge,
Area, km�
km
Km�/year (%)
mill.t/year
Danube
817 000
2 860
208 (64.6)
51.7
Dnieper
505 810
2 285
51.2 (15.9)
2.12
Kizilirmak
78 200
1 151
5.02 (1.6)
5.02
Dniester
71 990
1 328
10.2 (3.2)
2.50
Southern Bug 68 000
857
3.0 (0.9)
0.53
Sakarya
65 000
790
6.38 (2.0)
6.38
Yesilirmak
36 100
416
4.93 (1.5)
4.93
Coruh
22 000
500
8.69 (2.7)
15.13
Rioni
13 300
228
12.8 (4.0)
7.08
Inguri
4 060
221
4.63 (1.4)
2.78
Kodori
2 030
84
4.08 (1.3)
1.01
Bzyb
1 410
-
3.07 (0.9)
0.60
Total
1 684 900
-
322 ( 100)
As we mentioned earlier only 13% of the total volume of the Black Sea
contains oxygen. The rivers, therefore, transport each year to the Black
Sea the volume of the fresh water, which is comparable to the seawater
volume containing oxygen. The catchment area of the Danube is of 1.5
times of the sea surface area (547000 km�). These figures strongly
support the need to extend the geographical coverage of the Black Sea
LBS Protocol to the river catchment areas at least within the territory of
the country party to the Bucharest Convention like in the Mediterranean
LBS Protocol. The Protocol thus will provide a legislative basis for
national governments and the Commission of the Bucharest Convention
to develop integrated and coherent policies to reduce input of the
nutrients to the Black Sea from the whole catchment area. Of
considerable interest, with this respect, are the requirements of the EU
Directive to use Rive Basin Management and to establish River Basin
242
243
Annex1
Districts. Not only will this include the area of land surface run-off to the
estuary but will include groundwater and coastal waters.
The following terms defined in the EU Directive might be used for the
amendment of the Protocol:
� "Surface water".
� "Surface fresh water".
� "Fresh water limit".
� "Coastal water.
� "Estuary".
� "River basin".
� "River Basin District".
If the countries are not willing to elaborate so much they can use the
definition of the "Hydrologic Basin" from the Mediterranean Sea LBS
Protocol. This definition, also not so detailed, will nevertheless extend the
Protocol area application to the entire watershed area within the territories
of the Contracting Parties, draining into the Black Sea.
If the Black Sea countries are inclined to follow the EU Directive
requirements the Protocol should include provisions for each of them to:
� identify individual river basins lying within their national territories
and assign them to a river basin district that should include
relevant groundwater, and coastal waters. In those rivers, which
cross national boundaries, an international river basin districts should
be set up.
� establish and regularly update a river basin management plan for each
river basin district � some of which will transcend national frontiers.
� establish a programme of measures to ensure that all waters in the river
basin achieve the objective of good water status.
Importance of the diffuse sources of the nutrients necessitates taking of a
combined approach to pollution control. This will require Participating
Countries to set down in their programmes of measures both limit values
to control emissions from individual point sources and environmental
quality standards to limit the cumulative impact of such emissions as well
as of diffuse sources of pollution.
Amending the Protocol the participating countries may wish to take into
account the Global Programme of Action for the Protection of the Marine
Environment from Land-based Activities and the Washington
Declaration.
The amended Protocol, in this respect, should provide for:
(a) Innovative financing mechanisms that will assist the implementation of
national and regional programmes of action;
(b) Development of national action strategies and programmes in a regional
and subregional context.
243
244
Annex1
(c) Development and implementation of the programmes of action on a timetable
appropriate to regional circumstances and guided by the Commission of the
Bucharest Convention.
(d) Strengthening of regional information networks for communicating with
clearing-houses and other sources of information;
(e) Close collaboration between the national and regional focal points and regional
economic groupings, other relevant regional and international organizations,
development banks and regional rivers authorities / commissions, in the
development and implementation of regional programmes of action;
(f) Cooperation between and among regional organizations / conventions to
promote the exchange of information, experience and expertise;
The amended Protocol should provide for close cooperation and
coordination of actions for protection and management of water between
the Black Sea countries and the countries of its basin. Cooperation with
the countries in the basins of Danube and Dnieper should be specially
mentioned. The mechanisms for such cooperation might be also regulated
by the amended Protocol.
Provisions for preparation of the regional action plan and country level
investment projects for nutrient reduction.
The nutrients enter the marine environment with rivers run-off, direct
discharge, the surface run-off and atmospheric fall-out. The Black Sea
Transboundery Diagnostic Analysis (TDA) exposed that the international
rivers accounted for more than 80% of the Biological Oxygen Demand
and Total Suspended Solid loads. Some 58% of the total nitrogen and
66% of the total phosphorus flowing in dissolved form into the Black Sea
come from the Danube Basin. Some studies indicate that about 30% of
dissolved nitrogen and phosphorus are coming from the non-coastal
countries (see Annex 2).
However, the authors of TDA caution to interpret the nutrient influx
from the Danube as being the only issue worthy of action. The data
reveals rather large BOD fluxes from virtually all Black Sea countries.
Many of these discharges correspond with inadequate treatment facilities
of so called "hot spots".
Therefore, the amended Protocol should provide for actions
coordinated in the whole catchment area including elimination of the
hot spots. The relevant provisions of the Mediterranean LBS Protocol
and EU Directive might help to amend the Black Protocol with this
respect.
Development of the coordinated measures, their approval and reporting
on the implementation are well elaborated in the Mediterranean LBS
244
245
Annex1
Protocol. The following clauses should be carefully studied by the Black
Sea countries while working on the amendment of their LBS Protocol:
45.1 "The Parties undertake to eliminate pollution deriving from
land -based sources and activities... To this end, they shall elaborate
and implement, individually or jointly, as appropriate, national
and regional action plans and programmes, containing
measures and timetables for their implementation..." ( Article
5).
45.2 "1. The meeting of the Parties shall ado pt, by a two -thirds
majority, the short-term and medium-term regional action plans and
programmes containing measures and timetables for their
implementation provided for in article 5 of this Protocol... 2.
Regional action plans and programmes as referred to in paragraph 1
shall be formulated by the Organization and considered and
approved by the relevant technical body of the Contracting
Parties... 3. The measures and timetables adopted in accordance
with paragraph 1 of this article shall be notified by the Secretariat
to all the Parties. Such measures and timetables become binding
on the one hundred and eightieth day following the day of
notification..." (Article 15)
45.3 The Parties shall submit reports every two years... to the
meeting of the Contracting Parties.... Such reports shall include,
inter alia:
(e) Statistical data on the authorizations granted in accordance
with the Protocol;
(f) Data resulting from monitoring as provided for in the Protocol;
(g)Quantities of pollutants discharged from their territories;
(h)Action plans, programmes and measures implemented in
accordance with the Protocol.
The EU Directive provisions for principle Rive Basin Management
through the establishment of River Basin Districts might be also used
in the amended Protocol as an instrument for the regulation of regionally
coordinated national and regional action plans and programmes,
containing measures and timetables for their implementation.
The precautionary principal and anticipatory actions should be included
in the action plans and programmes. The amended Protocol should also
have provision for harmonization of the water quality objectives and
application of the Integrated Coastal Zone Management as requested by
BSAP. The Protocol should establish an obligation for the Black Sea
countries to adopt and implement, in accordance with its own legal
system, the legal and other instruments required to facilitate Integrated
Coastal Zone Management. A mechanism for the preparation and
approval of a Regional Black Sea Strategy should be also elaborated.
245
246
Annex1
III. Conclusions and recommendations.
A lot of new developments have taken place in the field of combating
pollution from LBS since the adoption of the Black Sea LBS Protocol. If
the countries wish to see the Protocol as a modern legal instrument
providing for sustainable measures to eliminate or reduce eutrophication
of the Black Sea they should amend it considering the following policy
issues:
48.1 Extension of the geographical coverage in order to reduce the
input of the nutrients from the whole catchment area.
48.2 Elaboration and implementation of the regional action plans
and programmes containing binding measures and timetables.
48.3 Development of national action strategies and programmes in
a regional context.
48.4 Development of a n innovative financing mechanisms that
will assist the implementation of national and regional programmes
of action;
48.5 Application of the Rive Basin Management principles
through the establishment of the River Basin Districts.
48.6 Application of a combined approach to pollution control.
48.7 Preparation of a cod of a good agricultural practice and the
Black Sea cod of conduct in the coastal zone.
48.8 Reporting to the Contracting Parties meetings every two
years.
48.9 Inclusion in the action plans and programmes precautionary
principal and anticipatory actions.
48.10 Harmonization of the water quality objectives.
48.11 Application of the Integrated Coastal Zone Management.
48.12 Participation of NGOs.
The Black Sea countries may wish to consider the amendments of the
LBS Protocol as part of their obligations under the Global Programme of
Action for the Protection of the Marine Environment from Land-based
Activities.
We took a liberty to suggest some elements for amendments of the Black
Sea LBS Protocol (see Annex 5).
AN OUTLINE OF THE UNEP's ACTIONS TO BE
UNDERTAKEN FOR THE REVISION OF THE PROTOCOL.
UNEP/ROE should inform the Black Sea and Danube basins countries (or
members of the joint Danube-Black Sea Technical Working Group) on its
activities with regard to the legal instruments on reduction of the nutrients
input into the Black Sea and call for a meeting.
246
247
Annex1
The meeting should consider this report and similar report of a consultant
for the Danube basin, comment on both of them and recommend
UNEP/ROE the follow-up actions. As regards the amendment of the
Black Sea LBS Protocol the meeting should also elaborate on the above
policy issues and advise on the indicators assessing effectiveness of the
Protocol.
The role of the LBS Protocol in the whole GEF Nutrient Reduction
Programme is also a very important issue. The meeting should
recommend the Protocol as a legal instrument regulating preparation and
implementation of measures in the frame of the GEF Programme on
nutrient reduction.
After the meeting UNEP should organize preparation of an amended
version of the Protocol with the explanation note. Then one or two
meetings of experts will be required to finalize the text of the Protocol.
When the text of the Protocol is agreed upon at the expert level a meeting
of plenipotentiary should be called upon.
247
248
Annex1
Addressing Transboundary Priorities in the Danube/Black Sea Basin:
A Strategic Partnership
Introduction:
The GEF, its Implementing Agencies, the European Community and others are
working together to assist the 17 countries in the Danube/Black Sea basin in
addressing their top priority transboundary waters issues. The GEF Secretariat,
UNDP, the World Bank and UNEP, in consultation with other key donors, the
International Commission for the Protection of the Danube River, the Black Sea
Commission and the Danube and Black Sea Secretariats/PIU, have prepared this
strategy paper in order to:
� Describe the collaboration among the Implementing Agencies, funding
partners and Danube/Black Sea basin countries in the first "GEF Strategic
Partnership" to a geographic area in the International Waters focal area;
� Inform the GEF Council on the approach being taken by the GEF
Implementing Agencies in the Danube/Black Sea basin;
� Provide a framework for interagency and inter-governmental cooperation and
coordination in addressing transboundary issues in the Danube/Black Sea
basin;
� Help to leverage and coordinate additional inputs to the region from other
donors;
� Provide guidance and orientation for the development of the Danube and
Black Sea GEF Regional Projects;
� Serve as a tool to assure coherence between donor activities and the policies
and strategies of the respective Conventions;
� Provide guidance to assure coherence between donor activities and the
objectives and work programs of the respective Secretariats;
� Establish a common agreement among the countries and Agencies for
objectives and programmatic indicators that will be utilized to measure
progress over the five year program.
� Support the efforts of EU accession countries in the Danube/Black Sea basin
to comply with EU Water Directives (nitrate, phosphate) and the forthcoming
Water Framework Directives.
This basin-wide, multi-stakeholder collaboration is needed to accelerate on-the-
ground implementation of measures and to consolidate gains made in jointly reversing
nutrient over -enrichment and toxics contamination of the Danube/Black Sea basin
(see Annex 2) under the Global Programme of Action (GPA) for the Protection of the
Marine Environment from La nd-Based Activities. The participating countries have
the opportunity to shorten by one-half the time frame for significant environmental
improvements that have taken 2-3 decades to accomplish for other transboundary
waterbodies in Europe and North America. This draft was shared and discussed with
the countries at the recent Black Sea basin-wide Stocktaking meeting as part of
preparing their collaborative projects for consideration by the GEF Council in May,
2001.
248
249
Annex1
Objectives and Programmatic Indicators:
Objective 1:
In support of the implementation of the Black Sea and Danube Strategic Action
Plans and the "Common Platform for Development of National Policies and Actions
for Pollution Reduction under the Danube River Protection Convention", and taking
into account the mandate of the Sofia and Bucharest Conventions, Danube/Black
Sea basin countries adopt and implement policy, institutional and regulatory
changes to reduce point and non-point source nutrient discharges, restore nutrient
`sinks', and prevent and remediate toxics restore"hot spots"..
Indicators: By 2005, 100% of participating countries introduce one or more policy
or regulatory measures (including phosphorus-free detergents) to reduce nutrient
discharges in the agricultural, municipal, or industrial sectors, and to restore
nutrient "hot spots sinks (wetlands, flood plains), and to prevent and remediate
toxics "hot spots", and 50% adopt multiple measures, towards goals of maintaining
1997 levels of nutrient inputs to the Black Sea, and towards remediation of toxics
"hot spots"substantially reducing toxics contamination in the basin.
Objective 2:
Countries gain experience in making investments in nutrient reduction and
prevention and remediation of toxics "hot spots".
Indicators: 100% of participating countries implement one or more investments in
agricultural, municipal, land use or industrial sectors for nutrient discharge
reduction, nutrient sink restoration, and prevention and remediation of hot spots of
toxic substances, some with GEF assistance, by 2005 to accompany expected
baseline investments.
Objective 3:
Capacity of the Danube and Black Sea Convention Secretariats is increased through
permanent status, sustainable funding, and development of international waters
process, stress reduction and environmental status indicators adopted through
Convention processes.
Indicators: PCU/PIU functions evolve into Convention Secretariats (Danube already
in place; Black Sea effective September 2000); payments of contributionsby all
contracting parties made for 2001-03-29 and pledged for the period beyond project
duration; nutrient control, toxics reduction and ecosystem indicators assessing
processes in place, stress reduction, and environmental status, are developed,
harmonized and adopted for reporting to Secretariat databases by 2005.
Objective 4:
Country commitments to a cap on nutrient releases to the Black Sea at 1997 levels
and agreed targets for toxics reduction for the interim, and possible future reductions
or revisions using an adaptive management approach after 2004 are formalized into
aspecific nutrients control and toxics discharge protocol(s) or Annex(es) to the
respective Conventions or via other legally binding mechanisms.
249
250
Annex1
Indicators : Countries adopt protocols or annexes to their two conventions and/or
develop legally binding "Action Plans" regarding nutrients and toxics reduction
commitments as part of their obligations under the Global Programme of Action for
Protection of the Marine Environment for Land-Based Activities by 2005 towards
agreed goal to restore the Sea to 1960's environmental status. For the Danube, such
a commitment will be contained in the revised Nutrient Reduction Plans (coherent
with the ICPDR Joint Action Programme) and developed in accord with the
application of the relevant EU Water Directives.
Objective 5:
Implementing Agencies, the European Union, other funding partners and countries
formalize nutrient and toxics reduction commitments into IA, EU and partner regular
programs with countries.
Indicators: Regular programs of IA's and EC support country nutrient and toxics
reduction commitments during 2000-2005 as part of expected baseline activities and
incorporate them into CCF (UNDP), GPA Office Support (UNEP), CAS (WB), and
EU (Accession support) by 2005.
Objective 6:
Pilot techniques for restoration of Danube/Black Sea basin nutrient sinks and
reduction of non-point source nutrient discharges through integrated management
of land and water resources and their ecosystems in river sub-basins by involving
private sector, government NGO's and communities in restoration and prevention
activities, and utilizing GEF Biodiversity and MSP projects to accelerate
implementation of results.
Indicators : All countries in basin begin nutrient sink" restoration and non-point
source discharge reduction by 2005 through integrated river sub-basin management
of land, water and ecosystems with support from IA's, partners and GEF through
small grants to communities, biodiversity projects for wetlands and flood plain
conservation, enforcement by legal authorities and holistic approaches to water
quality, quantity and biodiversity of aquatic ecosystems.
The Danube/Black Sea Basin: A Strategic Partnership
To accomplish the objectives summarized above aimed at addressing Danube/Black
Sea basin pollution reduction, with particular attention to nutrients and toxic
substances, in the most efficient and coordinated manner possible, the GEF and its
Implementing Agencies are proposing a strategic programme of capital investments,
economic instruments, development and enforcement of environmental law and
policy, strengthening of public participation, and monitoring of trends and
compliance. The programme would include both GEF and non-GEF (EC, EBRD, IA
regular programs, etc.) elements.
Operationally, within the GEF International Waters and Biodiversity focal areas, the
interagency Strategic Partnership proposed for the Danube/Black Sea basin includes
eight principal elements:
Elements of the Strategic Partnership:
250
251
Annex1
1. A GEF Black Sea Regional P roject implemented in cooperation with the Black
Sea Commission;
2. A GEF Danube River Basin Regional Project implemented in cooperation with
the International Commission for the Protection of the Danube River (ICPDR);
UNDP and UNEP propose to develop and jointly implement these two regional
capacity building projects aimed at addressing transboundary environmental
degradation in the Danube/Black Sea basin through policy and legal reform, public
awareness raising, and institutional strengthening. Each project will be operated
through or closely linked to the respective Black Sea and Danube Secretariats in
Istanbul and Vienna. The two projects will each focus on the following areas within
the Danube and Black Sea convention countries, with the GEF lead agency shown for
each:
1. a)
Actions to revise and/or create legally binding nutrients and toxics
reduction protocols/action plans to the Black Sea Convention in accordance
with the Global Programme of Action to Protect the Marine Environment
from Land Based Activities (UNEP). For the Danube, strategies and
measures for nutrient reduction will be reflected in the ICPDR Action Plan,
which will be endorsed and thus become legally binding to the contracting
Danube countries under the Danube River Protection Convention (UNDP).
2. b)
Activities to develop and implement policies and legislation aimed at
addressing sectoral causes of nutrient and toxics releases, such as phosphate
detergent phase-out, agricultural reform, cleaner production in industry, etc.
(UNDP);
3. c)
Policy and legislative reforms aimed at promoting the protection and
restoration of critical nutrient sinks, particularly wetlands and floodplains
(UNDP);
4. d)
Strengthening of the institutional capacities of the Black Sea and
Danube Secretariats to build in long-term capacity to understand, address
and monitor levels and impacts of transboundary nutrients and toxics
(UNDP);
5. e)
Public awareness raising in support of basin-wide nutrient and toxics
reduction efforts (UNDP);
6. f) Harmonization of water regulatory standards (in line with EU regulations
and new Convention protocols, where applicable) among the Danube/Black
Sea basin countries to include similar nutrient and toxics reduction
provisions (UNDP);
7. g)
Development of Black Sea and Danube River basin Monitoring and
Evaluation indicators harmonized among countries for process, stress
reduction and environmental status indicators (UNDP);
h) Strengthening of the Information System to allow interactive information
exchange and update and development of public area for specific topics of
nutrient reduction (UNDP);
251
252
Annex1
i) Support to further development of NGO activities at national and regional
level (UNDP);
j) Establishment of Small Grants Fund to reinforce community based actions
for nutrient reduction with particular attention to agricultural reform
projects, wetland restoration and use of lagoons for nutrient reduction
(UNDP);
k) FA feasibility studies for a nutrients emission trading system at the national
and regional levels. The Black Sea project will coordinate an overall study
for the Black Sea basin as a whole while the ICPDR/KfW will carry out a
study specific to the Danube River Basin towards the possibility of
developing economic instruments for nutrient management in the Danube
River Basin (UNDP).
3. The World Bank-GEF Partnership Investment Facility for
Nutrient Reduction
The Partnership will finance incremental costs associated with the reduction of
nutrient loads and discharges into the Danube River, its tributaries, the Black Sea
and other rivers which feed it. Three types of projects (or combination thereof)
would be eligible for financing under the Partnership:
1. a)
Wetland restoration or creation, that reduce nutrients discharge or
loads;
2.b) Reform and improvement of agriculture and land management practices with impact
on nutrient use and/or diffuse discharges through run-off;
3.c)
Wastewater treatment in small communities (normally with a
population less than 100,000) and small industries or large ones if opportunity
exists.
The Partnership would finance specific components of World Bank or bilateral
financed projects. Baseline costs would be covered by a combination of national
financing, a World Bank --- or other IFI ---loan and grant funds from other sources.
The GEF financed component would leverage additional funds (including national
funds) in at least a 1:2 ratio against the amount of the GEF grant. Self-standing GEF-
financed projects without a corresponding World Bank loan or bilateral financing
could be also considered, in exceptional cases, if important policy reforms would be
accomplished by the GEF grant or where national funding, in cash and in -kind, is at
least as large as GEF funding (i.e. 1:1 ratio).
Eligible projects must have: (i) the endorsement of the country's GEF focal point;
(ii) be included in the country's Black Sea or Danube National Environmental
Program and selected as a priority investment; (iii) form part of the Regional
Environmental Program, as approved by the respective Commission; and (iv) the
proposing country be up to date on contributions to the Black Sea and/or Danube
Secretariat(s). This would include an explicit recognition from the countries that the
transboundary control of nutrients is a priority issue in their NEAP/NAPs.
252
253
Annex1
As in the case of all GEF financed projects, eligible projects will be prepared,
appraised and implemented under the same terms as a regular World Bank
project and subject to the standard World Bank review process before being
submitted to the GEF Secretariat. Therefore, institutional requirements,
sustainability, financial, economic, social and environmental conditionality
normally required in World Bank projects would also apply to Partnership
projects.
Whenever a project has additional global benefits, such as biodiversity preservation (i.e.
through the recovery of a Ramsar site), the existence of such additional benefits would be a
positive factor, but not constitute an eligibility criteria, even though it could lead to additional
incremental GEF resources. In any case, nutrie nt removal is the essential eligibility condition
for all projects.
The World Bank is preparing the Partnership ForInvestment Facility for Nutrient Reduction
proposal for consideration at the May, 2001 meeting of the GEF Council. A figure of
approximately $60 million would be reserved for nutrient reduction investments under the
Strategic Partnership as described above. Additional contributions will be solicited from
bilateral donors. If approved, the World Bank could then vet projects directly through the
GEF Secretariat without having to bring each separate project to Council. Two concepts,
Bulgaria Wetland Restoration and Romanian Agricultural Reform, have already been
approved as likely components of the investment programme. The GEF Secretariat would
review and approve projects based on the criteria summarized above.
The World Bank will also promote the Investment Partnership, the investments it supports
and the Strategic Partnership in its country dialogues, include the Black Sea and
Danube perspectives in relevant World Bank Country Assistance Strategies (CASs) as
they are updated, and promote policies that address nutrient reduction as part of
country dialogues. These activities will be closely coordinated with related and
supporting activities planned under the Black Sea and Danube Regional Projects.
4. The GEF Dnieper Basin Environment Programme (DBEP):
The Dnieper River transports some 20,000 tons of nitrogen annually to the Black Sea, further
exacerbating the Black Sea's eutrophication problem. A GEF project to assist the riparian
countries of the Dnieper River (Russia, Belarus and Ukraine) in the development and
implementation of a Transboundary Diagnostic Analysis and a Strategic Action Programme
for the Dnieper River basin was approved by GEF in March, 1998 and commenced full
implementation in September, 2000. Inter alia, the project will assist the Dnieper basin
countries in identifying, prioritizing and addressing both point and non-point sources of
nutrient and toxics pollution to the Dnieper and the downstream Black Sea, through legal,
policy and institutional reforms and priority investments. The GEF Dnieper project is
designed to enable full coordination of project activities with the Danube/Black Sea basin
Strategic Partnership.
5. Georgia: World Bank GEF Agricultural Development Project II
The overall development objective of the project is to increase agricultural production
sustainably, while reducing pollution of natural resources. The project includes reforms
targeting prevention of nutrient releases. It represents the first phase of a ten-year Program, to
be implemented in three phases, for the reform of on-farm agricultural and environmental
practices. Under phase one, GEF would support the costs of implementing measures aimed at
improving on-farm environmental practices, such as storage and management of manure
water quality monitoring, which over the long term would reduce nutrients from entering the
Black Sea.
253
254
Annex1
6. GEF Biodiversity and Medium-Sized Projects in the Danube/Black Sea basin
GEF Biodiversity and Medium Sized Projects in the Danube/Black Sea basin to
address nutrients and toxics hot spots and nutrient sinks, test different approaches
and catalytically accelerate on-the-ground results. These include:
Biodiversity Projects:
Integrated Coastal Management Project, Georgia (World Bank; WP entry 7/98)
Danube Delta Biodiversity, Romania (World Bank; WP entry 4/92)
Biodiversity Conservation in the Azov-Black Sea Ecological Corridor, Ukraine (World Bank;
WP entry 1/98)
Danube Delta Biodiversity, Ukraine (World Bank; WP entry 4/92)
Integrated Biodiversity Conservation and Wetland Management for the Mid-Pripyat River
and Floodplains (UNDP, PDF -A)
Integrated Management of the Carpathian River Basins (GEF project conce pt, OP12)
Medium-Sized Projects:
Transfer of Environmentally Sound Technology (TEST) to Reduce Transboundary
Pollution in the Danube River Basin (UNDP; MSP concept approved by GEF
December, 1999; brief approved by GEF August, 2000; implementation commenced
February, 2001; UNIDO as Executing Agency)
Building Environmental Citizenship to Support Transboundary Pollution Reduction in
the Danube: A Pilot Project in Hungary and Slovenia (UNDP; MSP approved
November, 1998; implementation commenced April, 2000; Regional Environment
Centre as Executing Agency)
7. Nutrient control and reduction Projects executed by European Bank for
Reconstruction and Development (EBRD) under the new GEF `Expanded
Opportunities for Executing Agencies':
EBRD's main focus is to i dentify bankable investment projects together
with supporting activities to facilitate these investments. EBRD
contributes to pollution reduction in the Danube and Black Sea Basin by
financing projects particularly in the municipal and industrial sectors,
and by applying environmental appraisal procedures and international
environmental standards to all of the Bank's operations in the region.
254
255
Annex1
Danube Pollution Reduction Programme: Financing of Pollution
Reduction Projects by Local Financial Intermediaries (IA: UNDP):
The main objective of the project is to facilitate principally small and
medium sized private sector investment projects in the industrial and
agricultural sector. The project would identify mechanisms, using the
Bank's local financial intermediaries within the relevant countries to
provide to the private sector financial resources, including loans and
GEF grants for eligible components for the reduction of pollutants that
are responsible for the degradation of the aquatic environment in the
Danube River Basin and the Black Sea. Considering the pilot
character of the investments, the proposed project will initially
concentrate on Slovenia.
8. Accelerated implementation of environmental management
programs for mining related "hot spots" identified by the Danube
SAP and TDA.
This activity would support accelerated actions to address "hot spots" in
the Danube River Basin and other basins associated with mining
operations and tailing ponds. This would allow for targeted investments,
consistent with ICPDR proposed actions for prevention and control of
accidental pollution, to improve emergency warning systems, develop
preventive management programs and undertake selected priority
investment actions. The activity would complement ongoing UNEP and
EU activities to support the development and implementation of medium
and long-term preventive measures for management of operating,
decommissioned and abandoned tailing dams at priority "hot spots" in the
Danube River Basin. This would provide a mechanism to enhance joint
efforts in the Tisza River basin and other areas where similar "hot spots"
exist and there is a significant need for improved preventive management
programs.
255
256
Annex1
Non-GEF Activities which support the Strategic Partnership:
European Union
The European Union is a major political and financial actor in the Central and
Eastern European and NIS area mainly through its enlargement and NIS relations'
policies.
The enlargement of the EU to the ten candidate countries of Central and Eastern
Europe will involve:
� The adoption and implementation by these countries of the EU environmental
legislation and standards as a prerequisite for their entry into the Union
� The financial assistance by the EU to these countries toward the development of
the infrastructures necessary for the implementation of the EU legislation
The financial assistance will involve primarily the pre-accession financial
instruments PHARE and ISPA.
In March 1998 the Commission, the World Bank and the EBRD signed a
Memorandum of Understanding on pre-accession financing. This was updated in
March 2000 to take account of the new pre-accession financial instruments (ISPA
and SAPARD) and to extend co-operation to cover the NIS countries.
The Memorandum includes commitments to:
� Co-ordinate project implementation;
� Implement co-financing projects jointly which foster the adoption of the EU
legislation;
� Identify future co-financing opportunities which could foster accession;
� Be as flexible as possible with the delivery of the grants.
The PHARE-funded Large Scale Infrastructure Facility ( 250 million for 1998-99)
was developed to co-finance accession-related projects in transport and environment
with the international financing institutions (IFIs). Realising that environmental
projects would take much longer to put together than transport ones, DG
Environment of the European Commission co-operated with the World Bank to
develop a pipeline of viable projects to enable environment to take a reasonable
share of the new Facility, screening all projects for accession relevance. The result
was a substantial list of environmental co-financing projects for 1998 and 1999
(50% of the total Facility).
The ISPA instrument has some 500 million a year to spend on environmental
infrastructure investment over the period 2000-06. The minimum size of projects is
normally 5 million, and there is money for project preparation. Although the
ISPA Regulation does not formally require co-financing with the IFIs, this is greatly
encouraged. ISPA needs a project pipeline, while the grants could make it easier for
the IFIs to lend to the accession countries.
DG ENV is developing a Priority Environmental Investment Programme for
Accession (PEPA), which aims to develop investment strategies, priorities and a
project pipeline for all Community sources of finance and potentially non-
Community such as the World Bank. World Bank officials have participated actively
at a number of meetings to promote this project.
256
257
Annex1
The EU has concluded Partnership and Cooperation Agreements with each one of
the Newly Independent States. In this context it is providing financial assistance
through the use of the TACIS programme. The new TACIS Regulation foresees
greater assistance on environmental pre-investment activities.
To date Phare and Tacis have contributed about 18 million to the Black Sea
Environment Programme and about 8 million to the Danube Environment
Programme. The latest 4.6 million Tacis programme to the BSEP is ending in
2000. It gave support to the Black Sea Implementation Unit and to BSEP Activity
Centers in Georgia, Russia and Ukraine.
Under the new Tacis Regional Programme 2000 currently under preparation the
European Commission is planning on a 12 million Black Sea Investment Support
Programme for 2001-2003. The overall objectives of this programme will be :
Investment support
Co-financing with IFIs of pilot investments yielding significant environmental
benefits. These might include the following in particular:
� Waste water treatment (including nutrient removal)
� End of pipe industrial discharge treatment (including upstream industrial
facilities and oil terminals)
�
Grants to new industrial facilities designed to minimise polluting discharges
�
Landfills to replace marine waste dumping
� Prevention/remediation of oil spills from shipping
�
Construction of harbour facilities
The investments should be available for all riverine countries and would include up-
stream as well as coastal sites. Tacis should provide both technical assistance,
including project preparation, and investment grants in the form of interest subsidies
or otherwise.
Institutional support
Continuation of the work of the Black Sea Commission is of crucial importance for
concerted action of the riparian countries to tackle the problems of the Black Sea.
Support may also be included to the three Activity Centres in order to fulfill the
regional coordinating role for which they have also been designated . These are:
� Batumi, Georgia: biodiversity monitoring and development of strategy;
�
Odessa, Ukraine: water quality monitoring and development of strategy;
�
Krasnodar, Russia: coastal zone management.
EU is also anticipating a project on Nutrient Management in the Danube River Basin
and its impact on the Black Sea (total cost 3,5 million ) as part of its 5th Framework
Programme.
It will be important to seek the close cooperation of the EU programmes in the
Danube and Black Sea areas with those of the GEF, the World Bank, the EBRD etc.
so that synergies can be found in the execution of these programmes.
257
258
Annex1
European Bank for Reconstruction and Development (EBRD)
EBRD has carried out pre-investment regional and sector studies in the Danube River
Basin and technical co-operation projects in Hungary and Romania. The Bank's main
focus is to identify and to promote investment projects together with supporting
activities to facilitate these investments. The Bank attaches particular importance to
promoting environmentally orientated operations in line with its mandate, both
through "stand -alone" operations with primarily environmental objectives, such as
upgrading of waste water management and solid and hazardous waste management,
and also by financing environmental improvements in the industrial often as part of
a larger-scale restructuring and modernisation investment.
EBRD municipal environmental infrastructure projects under implementation:
Municipal Utilities Development Programme (MUDP) I and II, Romania:
Water and wastewater sector loans to two programmes covering 6 and 10 cities,
respectively. As well as improving the water quality of the Danube River and the
Black Sea, the municipal infrastructure investments will also bring the water
companies in line with EU environmental standards.
Maribor water and waste-water BOT project, Slovenia:
Loan to finance construction of a wastewater treatment plant in Maribor,
Slovenia's second largest city. The project will have a major positive impact on
the water quality of the Drava River.
Budapest Waste Water Services, Hungary:
The Bank has invested in the partly privatised Budapest Municipal Sewerage
Company (BMSC). BMSC has subsequently developed an environmental action
plan which will bring the facilities into compliance over time with both
Hungarian and EU environmental standards.
Zaporozhia-Water Utility Development & Investment Programme, Ukraine:
The project is financing investments in the water supply and waste-water sector
and enhancing the financial and operational performance of Vodokanal, the
municipally owned water and waste-water company of Zaporizhia . The project
will reduce discharges of untreated waste water into the Dnieper river and,
ultimately, the Black Sea.
Brno-Modice Waste -Water Treatment Plant, Czech Republic:
Loan to the water utility of the city of Brno to finance the extension and
upgrading of the Brno-Modice waste-water treatment plant and part of the city's
sewerage network, contributing to the further reduction of the pollution of the
River Svratka.
Zagreb landfill rehabilitation, Croatia:
EBRD has funded the rehabilitation of one of the largest uncontrolled landfills
in Europe to bring the landfill in line with EU environmental standards. The
project includes a leachate collection and treatment facility to prevent discharge
into the Sava River, a tributary to the Danube.
EBRD municipal environmental infrastructure projects under preparation:
-
Sofia Water, Bulgaria
-
Zagreb Waste-water treatment plant, Croatia
258
259
Annex1
-
Municipal Environment Loan Facility, Romania
-
Sevastopol Water, Ukraine
-
Municipal Utilities Development Programme, Ukraine
EBRD industrial projects under implementation:
Slovalco Aluminium Smelter, Slovak Republic:
EBRD made a loan and took equity to enable the company to complete the
construction and operation of a new smelter and to shut down inefficient and
polluting aluminium smelters and plants. Slovalco is now in full compliance
with EBRD's environmental covenants and is a "zero emission plant", with all
process waters being recycled and no wastewater discharges being discharged
from the site.
Ambro/Sic al, Romania:
An EBRD loan to Ambro to modernise its pulp and paper production facilities is
also resulting in improvements in environmental conditions at the plant,
including improvements in the treatment of black liquor, waste-water and
sludge.
Further examples of EBRD-supported industrial projects under implementation in
the water and wastewater management sector in the Danube catchment area are:
-
Egis (pharmaceutical industry), Hungary
-
Borchodchem (chemical industry), Hungary
-
TVK (chemical industry), Hungary
-
Petrom (petro-chemical industry), Romania
-
Somatra zink smelter, Copca Mica, Romania
-
ALRO aluminium smelter, Slotina, Romania
-
Phoenix copper smelter, Baia Mare, Romania
-
Policolor (print and ink factory), Bukarest, Romania, and Ruse,
Bulgaria
-
PIRDOP copper smelter, Bulgaria
-
Sodi (Solvay-processing), Bulgaria
-
Celhart (pulp and paper), Bulgaria.
The Bank has also undertaken environmental investments in the agribusiness sector
focusing, typically, on the control of waste-water discharges, the improvement of
waste-water treatment and the protection of groundwater.
UNDP Country Cooperation Frameworks/Regional Cooperation Frameworks
UNDP is supporting the Strategic Partnership through interventions under both its
Environment and Governance focus areas. Under Environment, during the pilot
phase Danube and Black Sea projects UNDP provided over $2 million in support to
Danube/Black Sea basin issues through projects such as:
� Ukraine: Improving Environmental Monitoring Capacity ($1.099 million;
1995-1999)
� Ukraine: Environmental Impact Assessment Demonstration ($138,000; 1997-
2000)
� Russia: Water Quality Evaluation and Prediction in Areas Affected by the
Chernobyl Accident ($278,000; 1997-2000).
259
260
Annex1
� Georgia: Capacity Building for the Ministry of Environment ($620,000;
1998-2000)
The Danube/Black Sea Basin Strategic Partnership has a strong focus on facilitating
legal, policy and institutional reform in support of transboundary pollution
reduction. These new laws, policies and institutions can only be effective if they
have the appropriate level of trust, legitimacy and credibility in civil society. In
addition, as has been the case in the West, environmental protection is being
propelled more and more by public demand. UNDP is supporting the empowerment
of individuals and NGOs with skills and information to increase their involvement
in the environmental policymaking and enforcement processes. During the Danube
and Black Sea pilot phase programs, UNDP provided assistance totaling nearly $6
million to the Black Sea basin countries in support of governance, democracy and
public participation. Sample projects included:
� Regional Umbrella Program to Support Democracy, Governance and
Participation in Europe and the CIS ($2.153 million, 1997-1999)
� Moldova: Governance and Democracy: Strengthening the Judicial and
Legislative Systems ($1.739 million, 1996-1999).
� Georgia: Capacity Building for the Ministry of the Environment ($0.620
million, 1998-2000).
� Regional Programme on the Environment and Development ($1.8 million,
1997-1999). National Agenda 21's, policy reforms, institutional
strengthening, public participation and networking, strengthening of inter -
sectoral cooperation.
In addition, through the GEF Small Grants Programme in Turkey, UNDP supported
a survey of monk seals and their habitats along the Black Sea coast, a coastal
management programme in the Black Sea province of Trabzon, and a small scale
Waste Water and Sanitation Project in the town of Hacimahmutlu.
Through its ongoing support to Environment and Governance in the Central
European and CIS countries, UNDP will continue to provide the framework for
successful implementation of the key reforms envisioned under the Strategic
Partnership. During the five year period of the programme, UNDP will support,
inter alia, the following projects which support the goals of the Strategic
Partnership:
� Implementing Local Agenda 21's in Turkey: Phase II (includes 3 Black Sea
provinces of Trabzon, Samsun and Zonguldak); ~$100,000.
� Turkey: National Programme for Environmental Management and
Sustainable Development (includes efforts to combat desertification);
$100,000.
� Management Planning for Conservation of Fen Mire Biodiversity in Belarus
(Dnieper River Basin), $143,000.
� Ukraine: Promoting and Strengthening Horizontal Cooperation (supports
Ukraine's process of triple transition to statehood, democracy and a market-
oriented economy by acquainting Ukrainian government officials and
policymakers with relevant reform experiences in other countries of the
region, Asia and Latin America); $65,000.
260
261
Annex1
� Support to Economic, Social and Administrative Reforms in Ukraine (aimed
at facilitating the implementation of the government's economic, social and
administrative reform programme by providing timely and effective expertise
to develop and implement policy reform initiatives); $704,000.
� Czech Republic, Slovakia and Slovenia: National Capacity Building for
Sustainable Development (institutional strengthening, integration of SD
principles into selected sectoral policies and programmes, enhancing SD
awareness); $300,000.
In addition, the GEF SGP will increase its links with the Black Sea Environment
Programme through projects in the Biodiversity and International Waters focal
areas. 7 of 33 recently submitted project concepts have direct relevance to Black
Sea environmental issues, including protection of the Mersin Fish (Huso), a
threatened species; raising public awareness to prevent Black Sea pollution; and a
small size waste water treatment project in Samsun.
Other Programs:
� World Wildlife Fund: Lower Danube Green Corridor
� Preparation of an Annex to the Danube River Protection Convention for the
protection of ecosystems and nature conservation
World Wildlife Fund Blue Danube Wetland Restoration Program
Future Considerations Under the Strategic Partnership.
Two activities not addressed in this Strategic Partnership will be considered in more
detail at a later date and initiated under the Black Sea Regional Project. The first is the
Black Sea -Bosphorus Straits-Mediterranean Sea Marine Electronic Highway (MEH)
Feasibility Study, and the second an International Waters Fisheries Component.
Regarding the MEH, the Black Sea GEF project identified shipping as a
transboundary issue and mechanisms needed to support environmental manage ment,
and the Secretariat is in a position to set environmental management shipping
guidelines, but this effort lends itself to a private sector initiative. A Black Sea
transboundary fisheries component will also be considered and integrated into the
Strategic Partnership, once selected preparatory activities have been completed by the
Black Sea Regional Project.
261
262
Annex1
Annex 1
Transboundary Issues in the Danube/Black Sea Basin
It is widely agreed that regional scale eutrophication driven by excess nutrient
inputs, primarily from riverine sources, is the major transboundary issue impacting
the Danube/Black Sea basin. As a result of the pollution source inventory conducted
during the preparatory work for the Black Sea Strategic Action Plan, it has been
possible to gather data on the inputs of dissolved nitrogen and phosphorus
compounds to the Black Sea (as of 1995). To the best of our knowledge8, some 14%
of total nitrogen are from Bulgaria, 27% from Romania, 12% from Ukraine, 10%
from the Russian Federation, les s than 1% from Georgia, 6% from Turkey and about
30% from the non-coastal countries (Austria, Belarus, Bosnia and Herzegovina,
Croatia, Czech Republic, Former Yugoslavia, Germany, Hungary, Moldova,
Slovakia, Slovenia). In the case of phosphorus, the figures are Bulgaria, 5%;
Romania, 23%; Ukraine, 20%; Russia, 13%; Georgia 1%; Turkey 12% and 26%, for
the remaining countries, a similar story to that of nitrogen.
According to the GEF Operational Strategy (p.48-49), the GEF strategy is to meet
the agreed incremental costs of:
Implementing measures that address the priority transboundary environmental
concerns.
Control of land-based sources of surface and groundwater pollution that
degrade the quality of international waters....High priority is also placed
on abatement of common contaminants such as nutrients,...
The Black Sea Strategic Action Plan states (p.10):
29. A Black Sea Basin Wide Strategy, negotiated with all states located
in the Black Sea basin, should be developed to address the eutrophication
problem in the Black Sea. The objective of the Strategy should be to
negotiate a progressive series of stepwise reductions of nutrient loads,
until agreed Black Sea water quality objectives are met. Such a Basin
Wide Strategy may also be required to ensure the reduction of inputs of
other pollutants into the Black Sea, in particular oil.
30. Given that the Danube is the largest single source of nutrient
inputs into the Black Sea, it is imperative that strategies for the
reduction of nutrients be adopted fo r this river.
8 Topping, G., H. Sarikaya and L.D. Mee (1998) Sources of pollution to the Black Sea. In: Mee, L.D.
and G. Topping (Eds) (1999 in press) Black Sea Pollution Assessment. UN Publications, New York,
380, 280pp
262
263
Annex1
The Common Platform for the Development of National Policies
and Actions under the Danube River Protection Convention
(DRPC) (chapter 3.2.4) states:
The eutrophication by nutrients from land -based sources of
pollution is one of the most serious environmental problems of the
Black Sea, one of the key explanations for its environmental decline
and the principal cause for the degradation of the Black Sea
environment. The main causes of negative regional effects on the
Black Sea ecosystems include:
� Pollution by untreated municipal and industrial wastes,
� Pollution from agricultural activities,
� Reduction of wetlands and forested areas.
In the framework of the DRPC implementation the following goals
and objectives have to be achieved:
Strategic Goals:
� to improve aquatic ecosystems and biodiversity
� to maintain and improve water resources quality and quantity
(sustainable use)
� to prevent, reduce and control water pollution from point and
diffuse sources, in particular where hazardous substances
and nutrients are involved;
� to prevent and control transboundary impact and contribute
to the Protection of the Black Sea from land -based pollution
sources
Specific objectives for the main sectors:
� to ensure biological and advanced waste water treatment in
the municipal and industrial sector
� to promote the use of BAT and the adoption of BEP in all industries,
particularly those involving hazardous substances
� to promote the adoption of BEP and sustainable land use in agriculture
.......
As a result of the severe economic downturn in the region following the political
upheavals of the early 1990's, the near collapse of the industrial and agricultural
sectors in the Danube/Black Sea basin countries has resulted in some modest short-
term reductions in nitrogen and phosphorus inputs to the Black Sea from the Danube
and probably other rivers. In recognition of this "window of opportunity" to catalyze
improvements in the status of the Black Sea ecosystem, the Joint Danube -Black Sea
Technical Working Group identified the following goal for the next seven years:
The long-term goal is for all Black Sea basin countries to take measures to reduce
nutrient levels and other hazardous substances to such levels necessary to permit
263
264
Annex1
Black Sea ecosystems to recover to similar conditions as those observed in the
1960s.
As an intermediate goal, urgent control measures should be taken by all countries in
the Black Sea basin, in order to avoid that discharges of nitrogen and phosphorus to
the Black Sea exceed those levels observed in 1997. This will require countries to
adopt and declare strategies that permit economic development whilst ensuring
appropriate practices and measures to limit nutrient discharge, and to rehabilitate
ecosystems which assimilate nitrogen and phosphorus. This target, monitored and
reported annually, shall be reviewed in 2007 with a view to considering further
measures that may be required for meeting the long-term objective.
The strategy put forth below integrates the technical, policy, legal, institutional and
investment frameworks summarized in the preceding sections.
Addressing Danube/Black Sea Basin-wide Eutrophication through Reduction
and Sequestering of Nutrient Releases:
The Joint Danube -Black Sea Technical Working Group identified four key measures
which could be taken to reduce nutrient discharges to the Danube/Black Sea basin.
These include:
1. Reform of agricultural policies to reduce non-point source run-off of fertilizers
and manure (buffer zones, manure storage clamps, erosion control, organic
agriculture, etc.);
2. Improved municipal and industrial wastewater treatment to capture nutrients,
particularly using alternative technologies with low capital and O&M costs (e.g.
constructed wetlands, advanced integrated ponding systems, etc.);
3. Rehabilitation of key basin ecosystems (e.g. wetland restoration) to enhance
their capacities as nutrient `sinks';
4. Changes in consumer practices (including use of phosphate free detergents),
including legislation (where needed), enforcement and public awareness.
264
265
Annex1
Annex 2
Preserving the Danube/Black Sea basin Environment: A brief history
The Black Sea was formed only seven or eight thousand years ago when changing
sea level sent Mediterranean water through the Bosphorous valley into what was
until then a large fr eshwater lake. Human populations emerged and flourished in the
basin, with little apparent negative impacts on the Sea or the rivers that feed it.
Though not very biologically diverse compared with open seas at similar latitudes,
the Black Sea developed remarkable and unique ecosystems, particularly in its
expansive northwestern shelf where the sea is relatively shallow. Today, the
Danube/Black Sea basin encompasses 17 countries and supports a population of
over 160 million people over an area of about ...s quare kilometers. Over the last 30-
40 years, as a result of rapid and largely unsustainable development,
industrialization and the `green revolution', the Black Sea and many of the rivers
that feed it have become severely degraded, with effects including:
� Loss of species diversity;
� Severe eutrophication over large areas (particularly in the NW shelf) due to
excess inputs of
nutrients;
� Declining water quality due to persistent inputs and levels of hydrocarbons
and
other chemicals from both marine and land-based sources;
� Landscape degradation due to unplanned coastal and watershed development;
� Introduction of exotic species (at least 26 in the Black Sea) with major
impacts on the ecosystem and on commercial fisheries;
� Overfishing which together with the environmental factors led to a decrease
in
the diversity of Black Sea commercial species from 26 species to 6 in less
than two decades;
� Increased frequency of outbreaks of waterborne diseases such as cholera and
frequent beach closures due to poor coastal water quality.
Donor and National Activity:
Recognizing the declining status of the Danube/Black Sea basin environment, in
recent years both the governments of the region and the international community
have taken steps to remediate the degradation of the Danube/Black Sea basin and to
prevent future impacts through a variety of reforms. Beginning in 1993, the Black
Sea Environment Programme (BSEP) was created with both donor and national
funding, including major inputs from the GEF and the European Union's TACIS and
Phare programs. The BSEP focused on enabling activities, capacity building, and
the preparation and approval of regional and national `Strategic Action Plans'
(SAP's). The BSEP focal areas included Emergency Response, Pollution
Monitoring, Biodiversity, Integrated Coastal Zone Management, Fisheries, Database
Management and Geographic Information System, Environmental Economics and
Investments, NGO's, Information and Communication and Policy and Legislation.
Similarly, in 1991, GEF, the European Union and the countries of the Danube River
basin created the Environmental Programme for the Danube River Basin (EPDRB),
designed to support the Danube countries in their long term objective of improving
the environmental management of the Danube river basin. EPDRB supported SAP
and NAP preparation, monitoring, collection and assessment of data, emergency
265
266
Annex1
response systems, pre-investment studies, institutional strengthening, capacity
building and reinforcement of NGO activities.
Concurrently, GEF and other donor-supported environmental protection activities
have been underway in other Danube/Black Sea Basin rivers, including the Dnipro
(GEF), Dniester (various), Don (World Bank) and Prut (Tacis) Rivers, and the Sea
of Azov (Dutch).
Legal Framework:
Both the Black Sea and the Danube, the largest river in the basin, have developed
and ratified international conventions (Black Sea Convention, Danube River
Protection Convention) whose objectives pertain to the prevention of pollution of
the Danube/Black Sea basin. The Danube River Protection Convention came into
force in October, 1998, the Black Sea Convention in February, 1994. A number of
the basin countries are also parties to the UN Economic Commission for Europe's
Convention on the Protection and Use of Transboundary Watercourses and
International Lakes. Most countries are also party to several other relevant
conventions, including the Convention on Biological Diversity, Convention on
Wetlands of International Importance (Ramsar Convention). At the national level,
numerous policies, laws and regulations exist relating to protection of Danube/Black
Sea basin resources, but exhibit a wide range of implementation, compliance and
enforcement. In most countries, legislation to address some of the priority
problems, especially transboundary ones, identified by the programs noted above is
still in its infancy. In the Danube Riv er Basin, most countries, especially those in
the accession process to the European Union are actually revising their policy and
legal frame for environmental and water protection to be coherent with EU water
directives.
Policy Framework:
The BSEP was the first programme to develop a systematic approach to policy
development through the application of a Trans boundary Diagnostic Analysis and a
Strategic Action Plan (SAP). The Black Sea SAP, contains 59 specific
commitments on policy regarding measures to reduce pollution, improve living
resources management, encourage human development in a manner which does not
prejudice the environment, and take steps towards improving financing for
environmental projects. In adopting this plan, the Black Sea governments have
committed themselves to a process of profound reform in the manner in which
environmental issues are addressed in the Black Sea and its basin. Preparation of
National Action Plans to operationalize the SAP at the national level is also
underway.
Concurrently, the Environmental Programme for the Danube River Basin adopted a
Danube River SAP in 1994 (revised in 1998 1999 as a Common Platform for
National Policies and Actions under the DRPC) which provides direction and a
framework for achieving the goals of regional integrated water management and
riverine environmental management expressed in the Danube River Protection
Convention. The most recent GEF intervention in the Danube sought to
operationalize elements of the SAP and Convention through the preparation of a
Pollution Reduction Programme (PRP) which was completed in July, 1999. Over $5
billion in investments, primarily at the national level and targeting `hot spots', were
identified and project files prepared.
266
267
Annex1
Preparation of a Strategic Action Programme and support to its implementation is
also planned in the Dnipro River Basin through UNDP -GEF and IDRC assistance.
Institutional Framework
Several emerging or operational institutions have key roles to play in the identification
and implementation of activities aimed at the remediation and protection of the
Danube/Black Sea basin waters and ecosystems. Key among these are the Commission
on the Protection of the Black Sea Against Pollution and the Secretariat of the Black Sea
Commission, and the International Commission for the Protection of the Danube River
and its Permanent Secretariat, each with responsibility for coordinating implementation
of the respective Conventions. The Danube Secretariat and the ICPDR Expert Groups
(Monitoring, Laboratory, Information Management Expert Group, Emission Expert
Group, Accidental Emergency Warning and Prevention Expert Group and Ad-hoc
Expert Group for Implementation of EU Water Framework Directives and River Basin
Management) are is fully operational and financially sustainable whereas the Black Sea
Secretariat has experienced repeated delays in overcoming political and bureaucratic
challenges to its establishment. It is hoped that these will be overcome shortly (April,
2000) and the Black Sea Secretariat will come into existence in late 2000 or early 2001.
In addition, donor-supported activities have resulted in the creation of non -permanent
institutions such as the Black Sea PIU and Danube PCU responsible for coordination of
the respective environment programmes.
Investment Framework:
Both the Black Sea and Danube Environment programmes have supported the
identification and preparation of investments aimed at remediating and preventing
environmental degradation in the Danube/Black Sea basin. Collectively, the 13
countries of the Danube River Basin invested approximately $560 million in
municipal and industrial wastewater treatment, agricultural water pollution
reduction, wetlands protection and water resources management in 1997-98. An
additional $4.29 billion in water sector investments is planned for the next 2-5
years. For the Black Sea riparians, a total of nearly $100 million in water sector
investments are underway or near completion.
267
268
Annex1
268